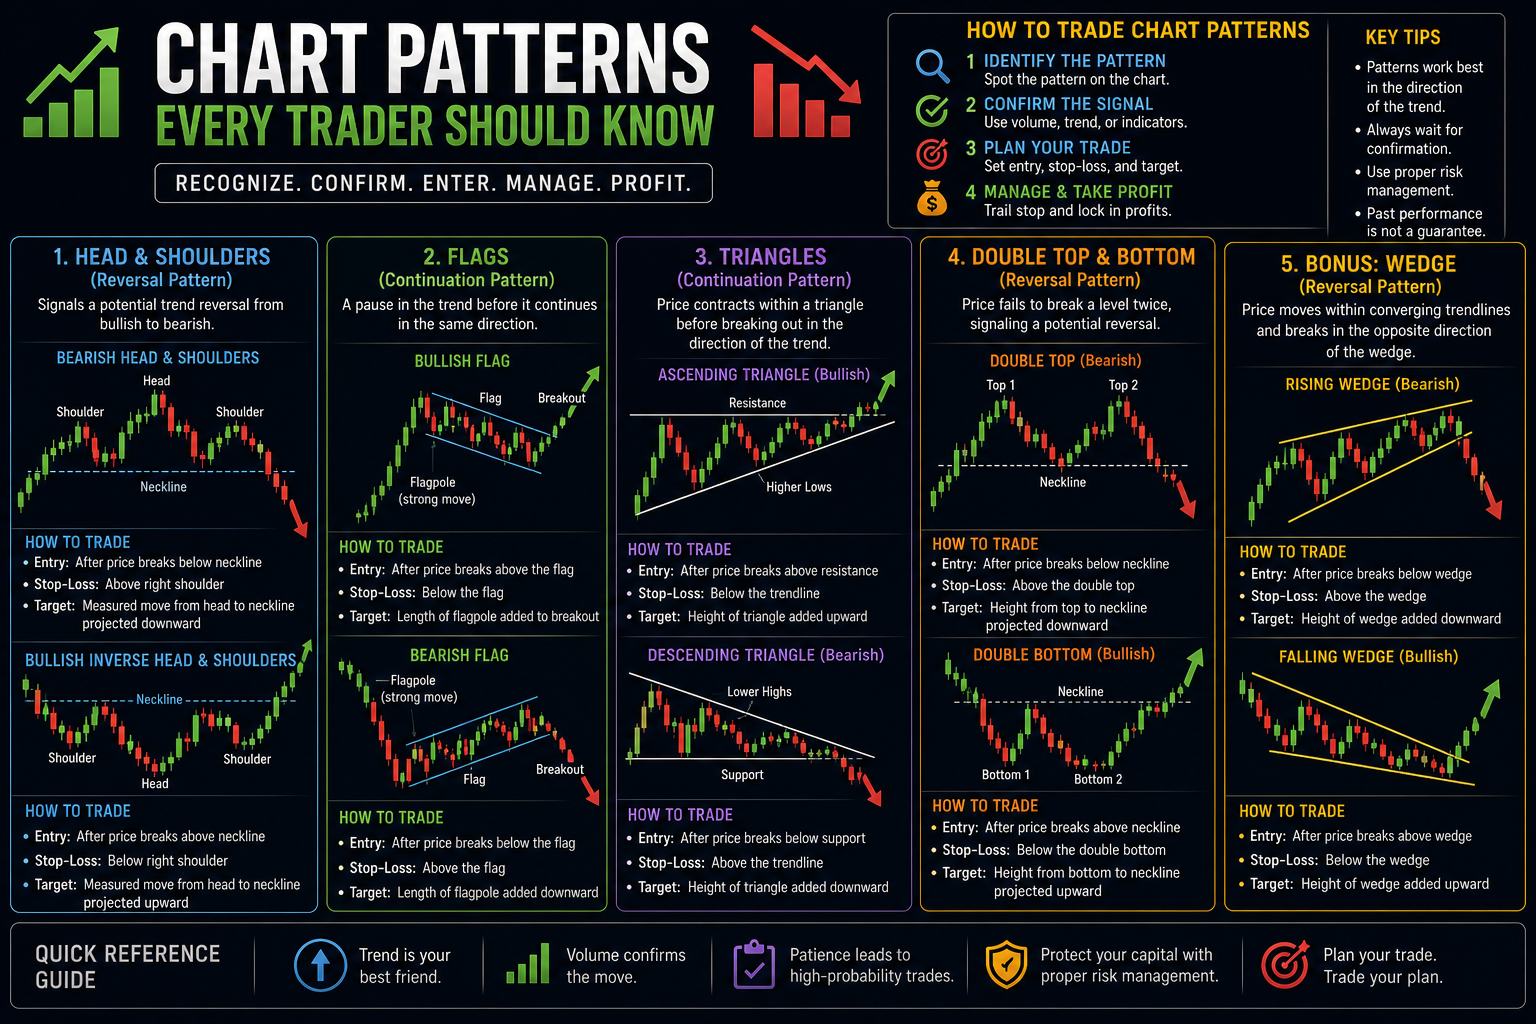
Chart patterns are the foundation of price action trading. They form when price movements create recognizable shapes that often signal future direction with high probability. Learning to spot these patterns gives traders a significant edge in predicting reversals and continuations.
In this comprehensive guide, we’ll cover the most important chart patterns every trader should know: Head & Shoulders, Flags, Triangles, and Double Top/Bottom. You’ll learn how to identify them, what they mean, and how to trade them effectively.
Important Disclaimer: Trading involves substantial risk of loss and is not suitable for everyone. This article is for educational purposes only and does not constitute financial advice. Always combine patterns with volume, confirmation, and proper risk management.
My Personal Perspective: The Power of Patterns, Flags, and Channels
Over years of tracking market movements, I have come to deeply appreciate the sheer power of trading patterns. They act as visual roadmaps of crowd psychology, showing you exactly when buyers or sellers are losing or gaining control. Among all the setups available, flags and channels remain absolute favorites in my personal trading routine.
However, experience teaches you a humbling lesson very quickly: chart patterns can be traps if you rush. They can be very hard to spot cleanly in real-time noise, and they demand strict discipline. In my experience, flags and channels must always be confirmed before they are executed properly. When you spot a clean flag or channel formation, verify the volume, and combine it with other confluence signals (like moving averages, RSI, or Fibonacci retracements), they become absolute keys to winning a trade and capturing massive continuation moves.
1. Head & Shoulders (Reversal Pattern)
The Head & Shoulders is one of the most reliable reversal patterns.
Structure:
- Left Shoulder: Price rises then falls
- Head: Higher peak than the left shoulder
- Right Shoulder: Similar height to left shoulder
- Neckline: Support line connecting the lows between shoulders
Inverse Head & Shoulders (Bullish reversal) is the mirror image at the bottom of a downtrend.
Trading Signal:
- Bearish: Price breaks below the neckline
- Bullish (Inverse): Price breaks above the neckline
- Target: Distance from head to neckline projected from the breakout point
Best Context: Appears after extended uptrends (bearish) or downtrends (bullish).
2. Double Top and Double Bottom (Reversal Patterns)
Double Top (“M” shape): Price tests a resistance level twice and fails, signaling a bearish reversal.
Double Bottom (“W” shape): Price tests a support level twice and bounces, signaling a bullish reversal.
Key Confirmation:
- Break of the neckline (low between the two tops/bottoms)
- Increased volume on the breakout
Trading Strategy:
- Enter on neckline break
- Stop-loss above the second top (for Double Top) or below the second bottom (for Double Bottom)
- Target: Pattern height projected from breakout
3. Flags and Channels (Continuation Patterns)
Flags and parallel channels are short-term consolidation structures that appear after strong directional impulse moves.
Bullish Flag / Ascending Channel: Sharp upward move (pole) followed by a controlled, downward-sloping or sideways correction. Breakout continues upward in the direction of the dominant trend.
Bearish Flag / Descending Channel: Sharp downward move followed by an upward-sloping consolidation. Breakout continues downward.
Trading Signal:
- Wait for a confirmed breakout in the direction of the underlying pole
- High probability when volume decreases during the flag formation and surges on the breakout
Because channels and flags frame price action so neatly, they are exceptional tools for trend continuation trades with tight, mathematically sound stop-losses.

4. Triangles (Continuation Patterns)
Ascending Triangle: Flat resistance with higher lows → Bullish continuation.
Descending Triangle: Flat support with lower highs → Bearish continuation.
Symmetrical Triangle: Converging trendlines → Can break either way (watch for direction of breakout).
Trading Strategy:
- Enter on decisive breakout with volume expansion
- Stop-loss just outside the opposite trendline
- Target: Height of the triangle base projected from breakout point
How to Trade Chart Patterns Successfully
- Identify the pattern on higher timeframes first (Daily/4H) to catch the true market structure.
- Wait for confirmation — Never anticipate a breakout; patience keeps you out of false moves.
- Check volume — Rising volume on the breakout drastically strengthens the trade signal.
- Combine with other tools — Use Support/Resistance, Moving Averages, RSI, MACD, or Fibonacci for added confluence.
- Measure targets using the structural height of the pattern.
- Apply strict risk management — Risk no more than 1–2% of your capital per trade.
Real-World Examples
Example 1: Head & Shoulders on Bitcoin In recent market cycles, BTC formed a clear Head & Shoulders pattern on the daily chart after a major rally. The neckline break led to a sharp 18% correction, matching the measured target perfectly.
Example 2: Double Bottom on Apple (AAPL) AAPL formed a textbook Double Bottom near major structural support in a strong uptrend. After breaking the neckline, the stock rallied aggressively, closely following pattern projections.
Example 3: Bullish Flag on EUR/USD During a strong trend, EUR/USD formed a clean bullish flag on the 4-hour chart. Waiting for confirmation of the channel breakout offered an exceptional reward-to-risk continuation trade.
Example 4: Symmetrical Triangle on Nasdaq The index formed a symmetrical triangle during consolidation. It broke to the upside with strong volume support, leading to a powerful expansion move.
Pros and Cons of Trading Chart Patterns
Pros:
- Visual, intuitive, and map out market psychology clearly
- Applicable across all asset classes and timeframes
- Provide well-defined entry, stop-loss, and target levels
- High success rate when properly confirmed
Cons:
- Can fail or turn into traps, especially in choppy, ranging markets
- Subjective interpretation among different market participants
- Require immense patience while waiting for proper structural confirmation
- False breakouts do happen
Pro Tip: The most reliable patterns form on higher timeframes, feature contracting volume during formation, and enjoy heavy volume expansion on the breakout.
Common Mistakes Beginners Make
- Jumping in prematurely before the pattern is fully confirmed
- Forcing patterns where price action doesn’t clearly support them
- Ignoring volume behaviour
- Trading patterns directly against the dominant macro trend
- Failing to maintain a healthy risk-reward ratio
Key Takeaways
- Chart patterns are powerful tools that reflect raw crowd psychology and supply-demand shifts.
- Reversal patterns (Head & Shoulders, Double Top/Bottom) signal potential trend transitions.
- Continuation patterns like flags and channels help you safely ride existing trends.
- Always wait for breakout confirmation and volume support before executing a trade.
- Combine patterns with support/resistance, moving averages, RSI, MACD, and Fibonacci for maximum edge.
- Practice spotting patterns on historical charts and log them diligently in your trading journal.
Mastering these chart patterns, alongside the technical indicators and concepts covered in previous posts (Moving Averages, RSI, MACD, Fibonacci, Support & Resistance), will significantly improve your price action reading skills and trading confidence.
In upcoming articles, we’ll explore more advanced patterns, volume profile analysis, and complete step-by-step trading strategies that tie everything together.