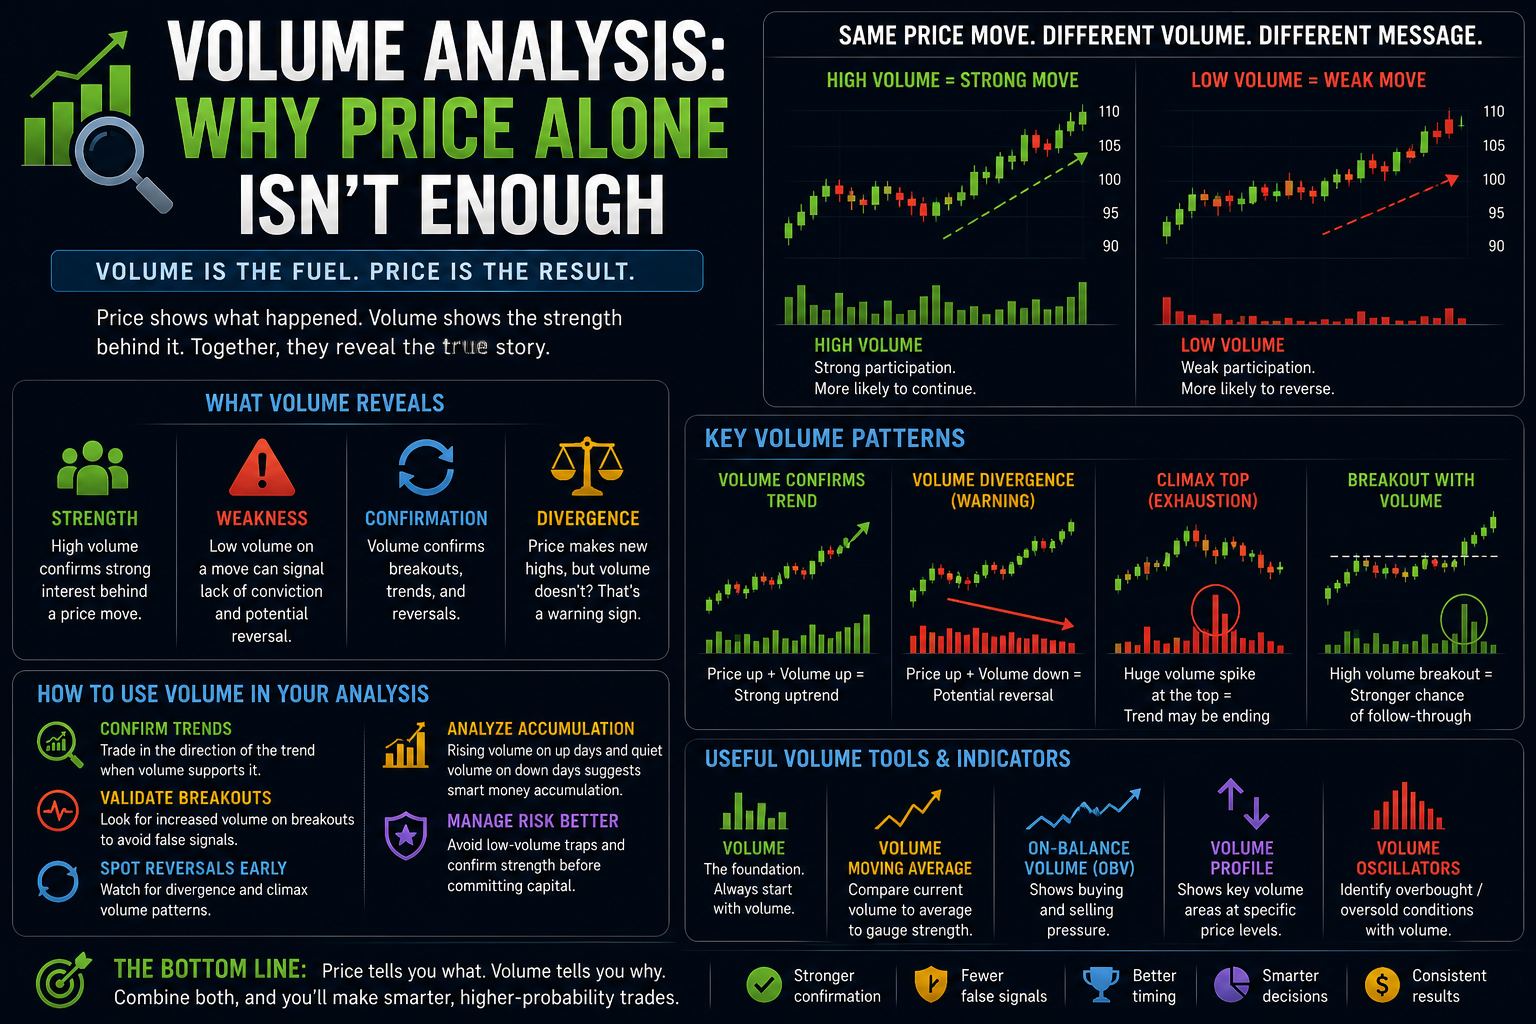
Price is what most beginners focus on when analyzing charts. However, professional traders know that volume is the fuel that drives price movements. Understanding volume analysis can dramatically improve your ability to confirm trends, spot reversals, and avoid false breakouts.
In this comprehensive guide, you’ll learn what volume really means, how to interpret it alongside price action, and practical ways to use volume analysis in your trading.
Important Disclaimer: Trading involves substantial risk of loss and is not suitable for everyone. This article is for educational purposes only and does not constitute financial advice. Always use proper risk management and combine tools for better results.
![Volume Spread Analysis [TANHEF] — Indicator by TanHef — TradingView](https://s3.tradingview.com/h/Hm9l210n_mid.webp?v=1773380481)
My Personal Perspective: Why Volume Is King and the Ultimate Confirmation Tool
Over the years, as I tested various indicators, moving averages, and oscillators, one truth became crystal clear: volume is king. In the trading community, many seasoned veterans argue that volume tells you the absolute truth when price action tries to lie. If you learn to read volume correctly, you possess one of the most powerful confirmation signals available in the financial markets.
From my point of view, price movements without volume backing them up are like smoke and mirrors—they lack institutional conviction and often result in brutal fakeouts. When I trade a breakout, a chart pattern, or a key support bounce, volume is the final judge. If a massive price expansion occurs on high, surging volume, it validates the move and gives me the confidence to execute. Mastering volume analysis transformed my trading by filtering out low-quality setups and ensuring I only rode trends backed by true market participation.
What is Volume in Trading?
Volume represents the total number of shares, contracts, or units traded during a specific time period (e.g., one candlestick).
- High volume = Strong market participation and institutional conviction
- Low volume = Weak interest, retail hesitation, and potential lack of follow-through
Volume is typically displayed as vertical bars at the bottom of your price chart.
Why Price Alone Isn’t Enough
Price can easily deceive you. A massive price push on low volume often lacks sustainability, whereas a sharp move accompanied by heavy volume exposes real smart-money interest.
Key Reasons to Analyze Volume:
- Confirms the genuine strength or weakness of an ongoing trend
- Validates legitimate breakouts while exposing dangerous fakeouts
- Helps identify market exhaustion and imminent reversals
- Reveals silent accumulation (buying) and distribution (selling) by institutional players
Trading price without volume means you are only seeing half of the market equation.
Key Volume Patterns Every Trader Should Know
1. Volume Confirmation in Trends
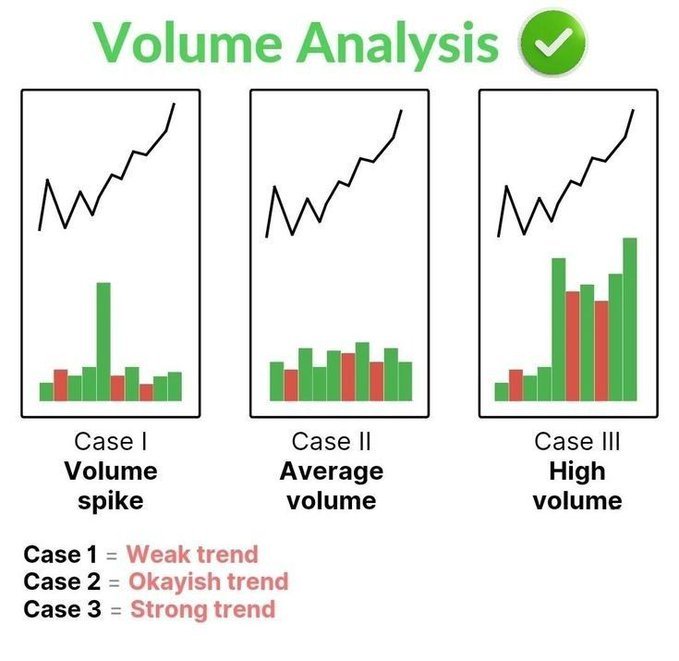
- Healthy Uptrend: Rising price + Rising volume = Strong bullish conviction
- Healthy Downtrend: Falling price + Rising volume = Strong bearish conviction
- Weak Trend: Rising price + Falling volume = Potential exhaustion and warning sign
2. Volume and Breakouts
- Valid Breakout: Price breaks resistance or support on significantly higher-than-average volume
- False Breakout (Fakeout): Price breaks a structural level on low or declining volume → often reverses quickly to trap breakout traders
3. Volume Climax (Exhaustion)
- Extremely abnormal volume spikes after a long extended trend often signal a reversal (buying or selling climax)
- A massive volume spike paired with a long candle wick frequently marks major turning points
4. Volume Divergence
- Price makes new highs while volume steadily decreases → Hidden weakness and potential trend reversal
- Price makes new lows while volume decreases → Possible accumulation bottom forming
Practical Volume Trading Strategies
Strategy 1: Volume-Confirmed Breakout
- Wait patiently for price to break a critical level (support/resistance zone or chart pattern neckline)
- Confirm the move with a sharp volume surge (at least 50–100% above the moving average volume)
- Enter the trade cleanly in the direction of the breakout
- Place your stop-loss safely on the opposite side of the broken level
Strategy 2: Volume Profile Trading
- Utilize Volume Profile to highlight High Volume Nodes (acting as strong support/resistance) and Low Volume Nodes (where price tends to cut through rapidly)
Strategy 3: Accumulation and Distribution Tracking
- Identify increasing volume on green up days while price holds steady near highs (accumulation)
- Watch for heavy volume spikes on red down days near resistance zones (distribution)
Strategy 4: Multi-Indicator Confluence
- Combine Volume + Candlestick patterns (e.g., a high-volume bullish engulfing candle)
- Combine Volume + Support & Resistance levels
- Combine Volume + Moving Averages or RSI
- Combine Volume + Chart Patterns (such as flags, channels, and triangles)
Real-World Examples
Example 1: Bitcoin Breakout In recent market cycles, BTC broke above a major resistance level near $88,000. The breakout candle showed volume more than 3x the average. This high-volume confirmation triggered a powerful continuation rally of over 20% in the following weeks.
Example 2: Apple (AAPL) Reversal After a strong rally, AAPL formed a Double Top pattern with noticeably declining volume on the second peak. This divergence warned of fading momentum. Price eventually reversed sharply downward following a classic volume climax.
Example 3: EUR/USD Fakeout EUR/USD briefly punched above a key resistance barrier on very low volume. The absolute lack of institutional participation caused price to reverse immediately, trapping aggressive breakout buyers. Traders monitoring volume skillfully bypassed this losing trap.
Pros and Cons of Volume Analysis
Pros:
- Adds immense confidence to price-based trading signals
- Filters out low-quality, choppy setups
- Functions effectively across stocks, forex, cryptocurrency, and futures markets
- Serves as the ultimate validator for chart patterns and technical indicators
- Unmasks hidden institutional accumulation and distribution
Cons:
- Volume data can occasionally be fragmented in decentralized markets like crypto
- Forex spot volume is often measured as “tick volume” rather than total contract volume
- Requires proper market context — volume in complete isolation can be misleading
- Can generate noise on extremely low intraday timeframes
Common Mistakes Beginners Make
- Ignoring volume data entirely and relying purely on clean lines
- Executing breakouts without demanding volume confirmation
- Over-relying on isolated volume spikes without checking the surrounding price structure
- Comparing volume incorrectly across different asset classes
- Failing to measure current volume against a rolling moving average baseline
Pro Tip: Add a simple “Volume Moving Average” indicator to your chart. It acts as an instant visual baseline to distinguish between normal market activity and true institutional volume surges.
Best Practices for Volume Analysis
- Always compare current session volume to the average over the past 20 to 50 periods.
- Prioritize volume readings on higher timeframes (Daily and 4-Hour) for superior reliability.
- Integrate volume with all the technical disciplines you’ve mastered—Support/Resistance, Candlesticks, Moving Averages, RSI, MACD, Fibonacci, and Chart Patterns.
- Log your volume observations meticulously inside your trading journal.
- Practice analyzing historical volume profiles to train your pattern recognition.
Key Takeaways
- Price tells you *what* happened, but volume tells you *how strong* and committed the participants were.
- High volume validates conviction, while low volume warns of caution and fakeouts.
- Volume is indispensable for confirming breakouts, sustaining trends, and catching reversals.
- The highest-probability setups occur when price action, chart patterns, and volume align perfectly.
- Never trade price in a vacuum—make volume analysis a core pillar of your routine.
- Consistent application of volume principles will significantly elevate your win rate and risk management.
Mastering volume analysis completes the final cornerstone of your technical analysis foundation. Tied together with everything covered in previous posts—from candlestick charts and support/resistance to momentum indicators like RSI and MACD, Fibonacci ratios, and chart patterns—you now possess a professional, well-rounded toolkit for reading any market with precision.
In upcoming posts, we’ll assemble these pieces into complete, step-by-step trading strategies and explore advanced execution frameworks!