One of the most powerful skills in trading is Multiple Timeframe Analysis (MTF). Instead of looking at just one chart, you analyze the same asset across different timeframes to get a complete picture of the market.
This approach helps you understand the bigger trend, find better entry points, and dramatically improve your trading accuracy. Professional traders rarely make decisions based on a single timeframe.
In this comprehensive guide, you’ll learn what multiple timeframe analysis is, why it works, and a clear step-by-step method you can start using immediately.
Important Disclaimer: Trading involves substantial risk of loss and is not suitable for everyone. This article is for educational purposes only and does not constitute financial advice. Always practice on a demo account first.

My Personal Perspective: Why MTF Check is My Go-To Method for the Best Positions
Over years of screen time and executing live orders, I’ve found that multiple timeframe analysis is quite simply one of the absolute best ways to enter a trade. Whenever I analyze a setup, I always do this check across multiple timeframes before I enter in order to secure the best possible position and avoid getting trapped by market noise.
From my point of view, zooming in and out of different charts bridges the gap between macro direction and micro execution. Looking at only a 5-minute or 1-hour chart is like navigating a jungle with a microscope—you lose sight of the massive cliffs ahead. By anchoring your analysis to higher timeframes for trend context and stepping down to lower intervals for surgical precision, you eliminate guesswork. Integrating MTF into your daily routine transforms your trading from a reactive guessing game into a structured, professional discipline.
What is Multiple Timeframe Analysis?
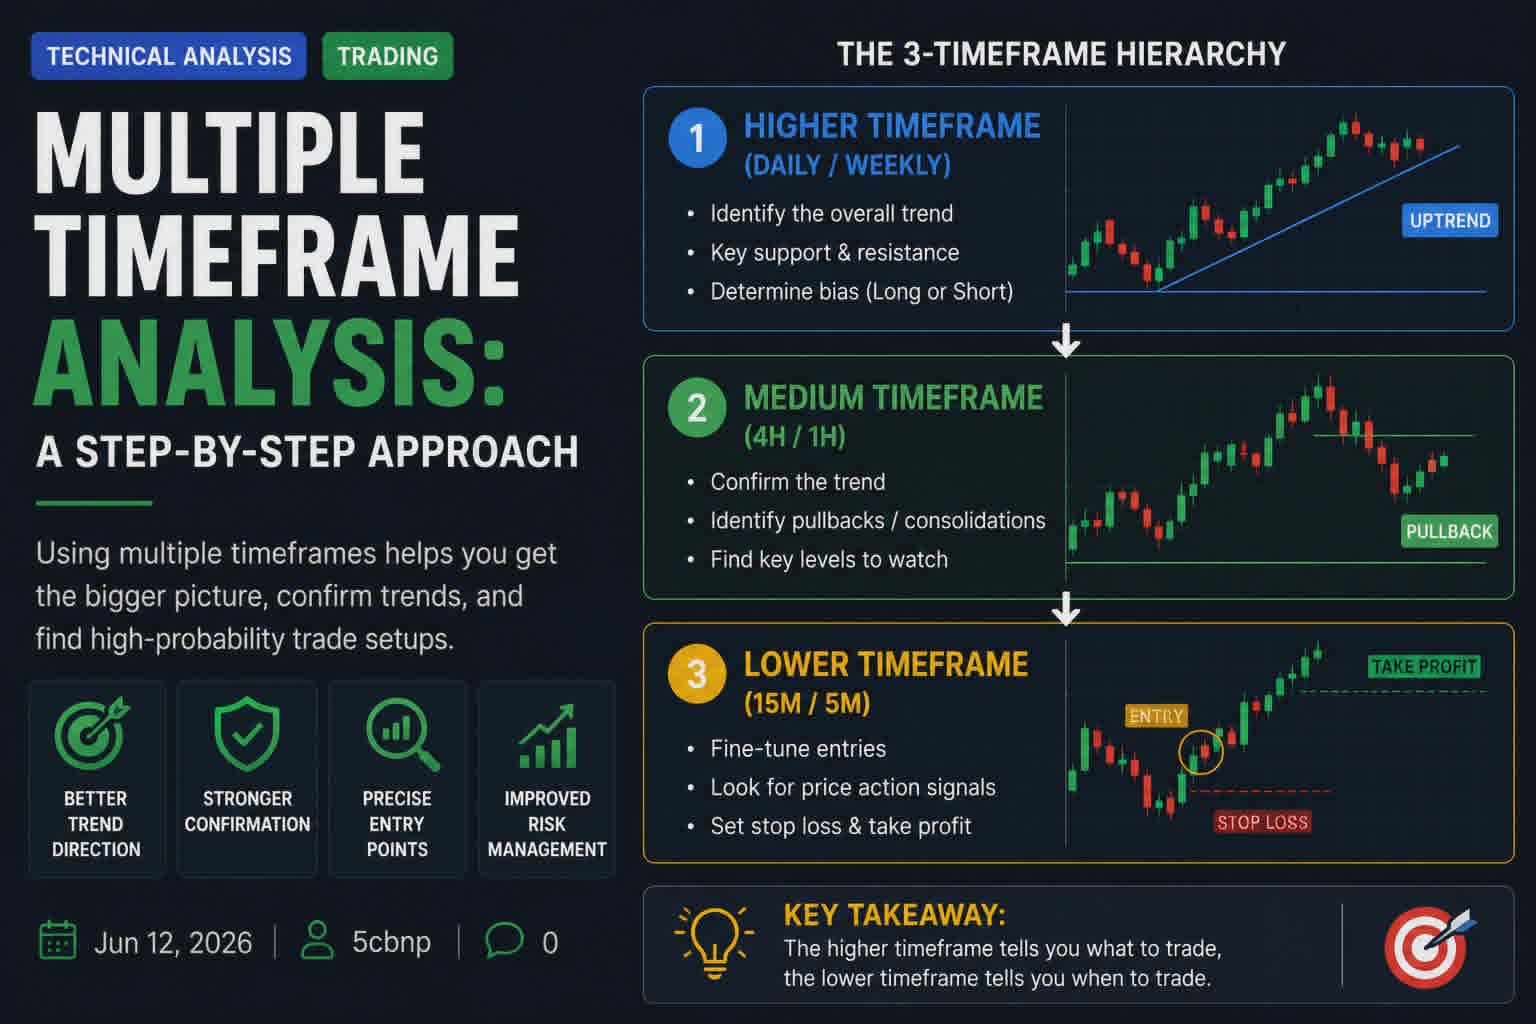
Multiple Timeframe Analysis means examining the same trading instrument on three or more different timeframes — typically a higher (trend), medium (context), and lower (entry) timeframe.
Common Timeframe Combinations:
| Trading Style | Higher (Trend) | Medium (Context) | Lower (Entry) |
|---|---|---|---|
| Day Trading | 4H or Daily | 1H | 15min or 5min |
| Swing Trading | Daily | 4H | 1H |
| Position Trading | Weekly | Daily | 4H |
The higher timeframe gives you the overarching directional bias, while the lower timeframe helps you time your entries with absolute accuracy.
Why Multiple Timeframe Analysis Works
- Higher timeframes reveal the dominant trend and major structural support/resistance zones.
- Lower timeframes provide superior risk-reward entries while filtering out background noise.
- It prevents you from fighting the macro trend—a classic trap that drains beginner accounts.
- Massively boosts trading confidence by confirming setups across multiple visual angles.
- Optimizes risk management by perfectly aligning your trades with the underlying market architecture.
Step-by-Step Approach to Multiple Timeframe Analysis
Step 1: Start with the Higher Timeframe (Trend Direction)
- Determine the macro trend: Is the market pushing in a clean uptrend, downtrend, or stuck in a choppy range?
- Map out major institutional support and resistance barriers.
- Identify key chart formations, moving averages (such as the 50 or 200 EMA), and Fibonacci retracement zones.
- Rule: Only trade in the direction of the higher timeframe trend unless high-conviction reversal confluence is present.
Step 2: Move to the Medium Timeframe (Market Structure)
- Zoom in to evaluate and confirm your higher timeframe analysis.
- Scan for intermediate pullbacks, consolidation channels, or structural breakouts.
- Check momentum indicators like RSI, MACD, and volume behavior for secondary confluence.
- Highlight sub-levels that harmonize with the higher timeframe map.
Step 3: Drop to the Lower Timeframe (Precise Entry)
- Wait patiently for price to tap into a critical zone derived from your higher timeframes.
- Look for exact execution triggers: candlestick reversal patterns, moving average crosses, RSI divergences, or MACD flips.
- Confirm the move with a surge in volume if possible.
- Define clear stop-loss and take-profit targets based on local market structure.
Step 4: Manage the Trade
- Monitor the active trade primarily using the medium timeframe structure.
- Scale targets or trail stop-losses according to higher timeframe milestones.
- Exit immediately if the dominant higher timeframe trend shifts or breaks invalidation points.
Practical Multiple Timeframe Trading Strategies
Strategy 1: Trend-Following Pullback
- Higher TF: Strong impulse uptrend, price comfortably above the 200 EMA.
- Medium TF: Healthy pullback into historical support or the 50 EMA zone.
- Lower TF: Clean bullish candlestick confirmation (like a hammer or engulfing bar) plus oversold RSI → Long entry.
Strategy 2: Breakout Confirmation
- Higher TF: Price approaching a major historical resistance ceiling.
- Medium TF: Tight consolidation forming a flag, channel, or triangle pattern.
- Lower TF: Decisive breakout candle backed by heavy volume expansion → Enter in the direction of the breakout.
Strategy 3: Counter-Trend Reversal
- Deploy only when higher timeframes flash undeniable exhaustion signals (such as major Head & Shoulders, Double Tops/Bottoms, or deep RSI/MACD divergence).
- Exercise extreme caution, reduce position sizing, and employ tighter risk controls.
Real-World Examples
Example 1: Bitcoin Swing Trade On the Daily chart (higher TF), BTC maintained a clear uptrend above the 200-day EMA. It retraced cleanly to the 50% Fibonacci level. Dropping to the 4H chart, a bullish engulfing candle formed alongside RSI divergence. The 1H chart finalized the entry with a clean MACD line crossover. This multi-layered setup captured a smooth 12% continuation rally.
Example 2: EUR/USD Day Trade The Daily chart flagged major structural resistance at 1.0950. On the 1H chart, price formed a textbook double top. Moving down to the 15-minute chart, a bearish engulfing candle on high volume provided a pristine short entry with exceptional risk-reward metrics.
Example 3: Apple Stock The Weekly chart highlighted a massive historical support zone. Following a healthy pullback, the Daily chart aligned precisely with a 61.8% Fibonacci retracement. The 4H chart delivered the precise entry timing via a hammer reversal candle and volume expansion.
Pros and Cons of Multiple Timeframe Analysis
Pros:
- Drastically increases win rates through multi-level technical confirmation
- Delivers superior risk-reward ratios for every executed position
- Minimizes emotional decision-making by replacing panic with a structured plan
- Adaptable across all asset classes (stocks, forex, crypto, and futures)
- Effectively filters out low-probability, choppy setups
Cons:
- Demands more preparation and analytical time before placing trades
- Can cause “analysis paralysis” if beginners clutter charts with too many variables
- Lower timeframes inherently contain more market noise
- Requires strict discipline to respect the higher timeframe trend
Common Mistakes Beginners Make
- Flipping through too many charts at once (stick strictly to three cohesive timeframes)
- Ignoring the higher timeframe bias and foolishly trading against the primary trend
- Pulling the trigger too early on lower timeframes without waiting for structural confirmation
- Overcomplicating the workspace with unnecessary indicator overlays
- Constantly second-guessing and switching timeframes mid-trade
Pro Tip: Start by mastering just three selected timeframes. Utilize split-screen layouts on platforms like TradingView to streamline your multi-chart workflow.
Key Takeaways
- Multiple Timeframe Analysis provides both the macro “big picture” and micro execution timing.
- Always top-down your analysis: start from the higher timeframe and work down to your entry chart.
- Trade in absolute harmony with the dominant trend for maximum statistical probability.
- Combine MTF execution with all the foundational skills you’ve learned: Support & Resistance, Candlesticks, Moving Averages, RSI, MACD, Fibonacci, Chart Patterns, and Volume.
- Practice this routine religiously on historical charts and log your findings in your trading journal.
- Patience and multi-chart alignment are the true cornerstones of consistent trading profitability.
Mastering multiple timeframe analysis serves as the ultimate capstone that ties together every technical concept covered throughout this series. It elevates scattershot trading into a structured, professional-grade framework.
In upcoming articles, we’ll dive into complete end-to-end trading strategies, trader psychology, and how to build a personalized business trading plan!