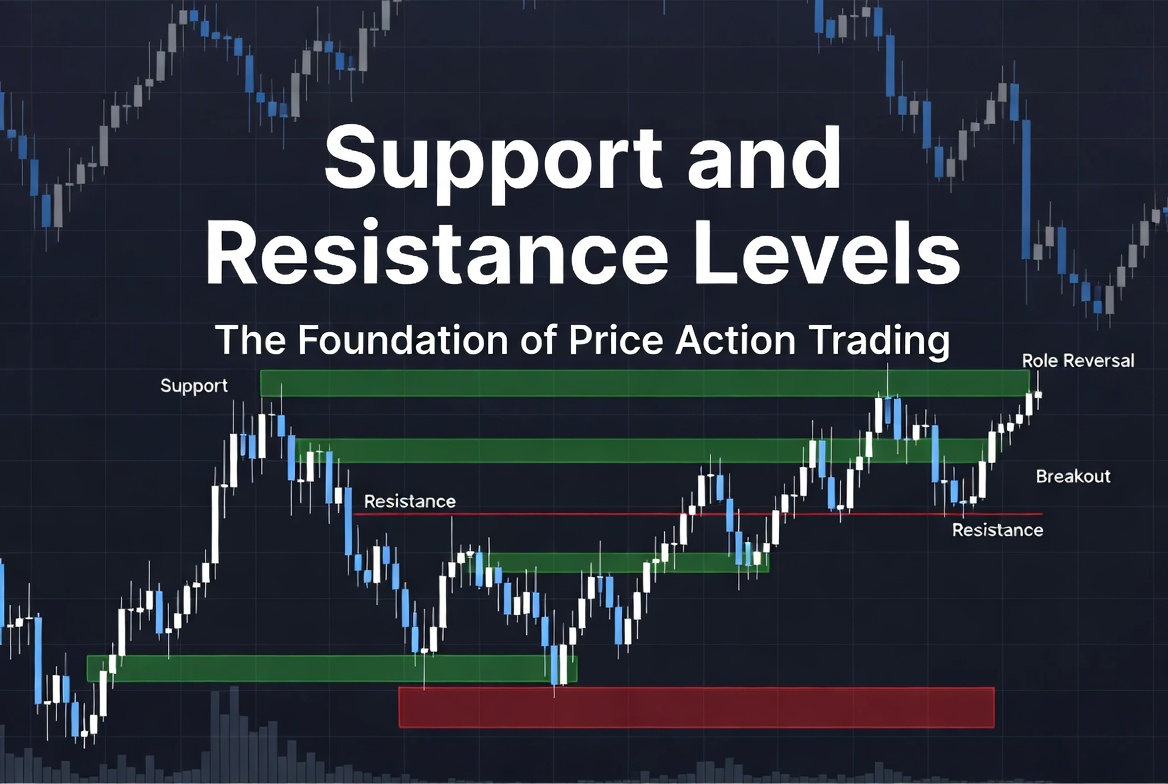
Support and Resistance levels are among the most important concepts in technical analysis and price action trading. They form the backbone of how professional traders read charts and make decisions.
Understanding support and resistance can dramatically improve your ability to identify high-probability trade setups, manage risk, and understand why prices move the way they do.
In this comprehensive guide, we’ll explain what support and resistance are, how to identify them, different types, trading strategies, and real-world examples.
Disclaimer: Trading involves substantial risk of loss and is not suitable for everyone. This article is for educational purposes only and does not constitute financial advice. Always trade responsibly.
My Personal Perspective: Why S&R Zones Are My Core Strategy
Over years of screen time and trading through various market conditions, I’ve learned that you don’t need a hundred complex indicators to be profitable. In my own trading, support and resistance zones are absolute essentials. They are quite literally the first thing I look for on any chart.
From my point of view, these zones tell you the exact story of where market participants are positioned. They give you a crystal-clear heads-up on when a price is likely to bounce or violently break through. Whenever I look for an entry, I rely on support and resistance as my primary map, pairing them directly with candlestick patterns to form a high-probability confluence system. When a key S&R level meets a powerful reversal candle, that is where the highest-probability trades happen.
What Are Support and Resistance Levels?
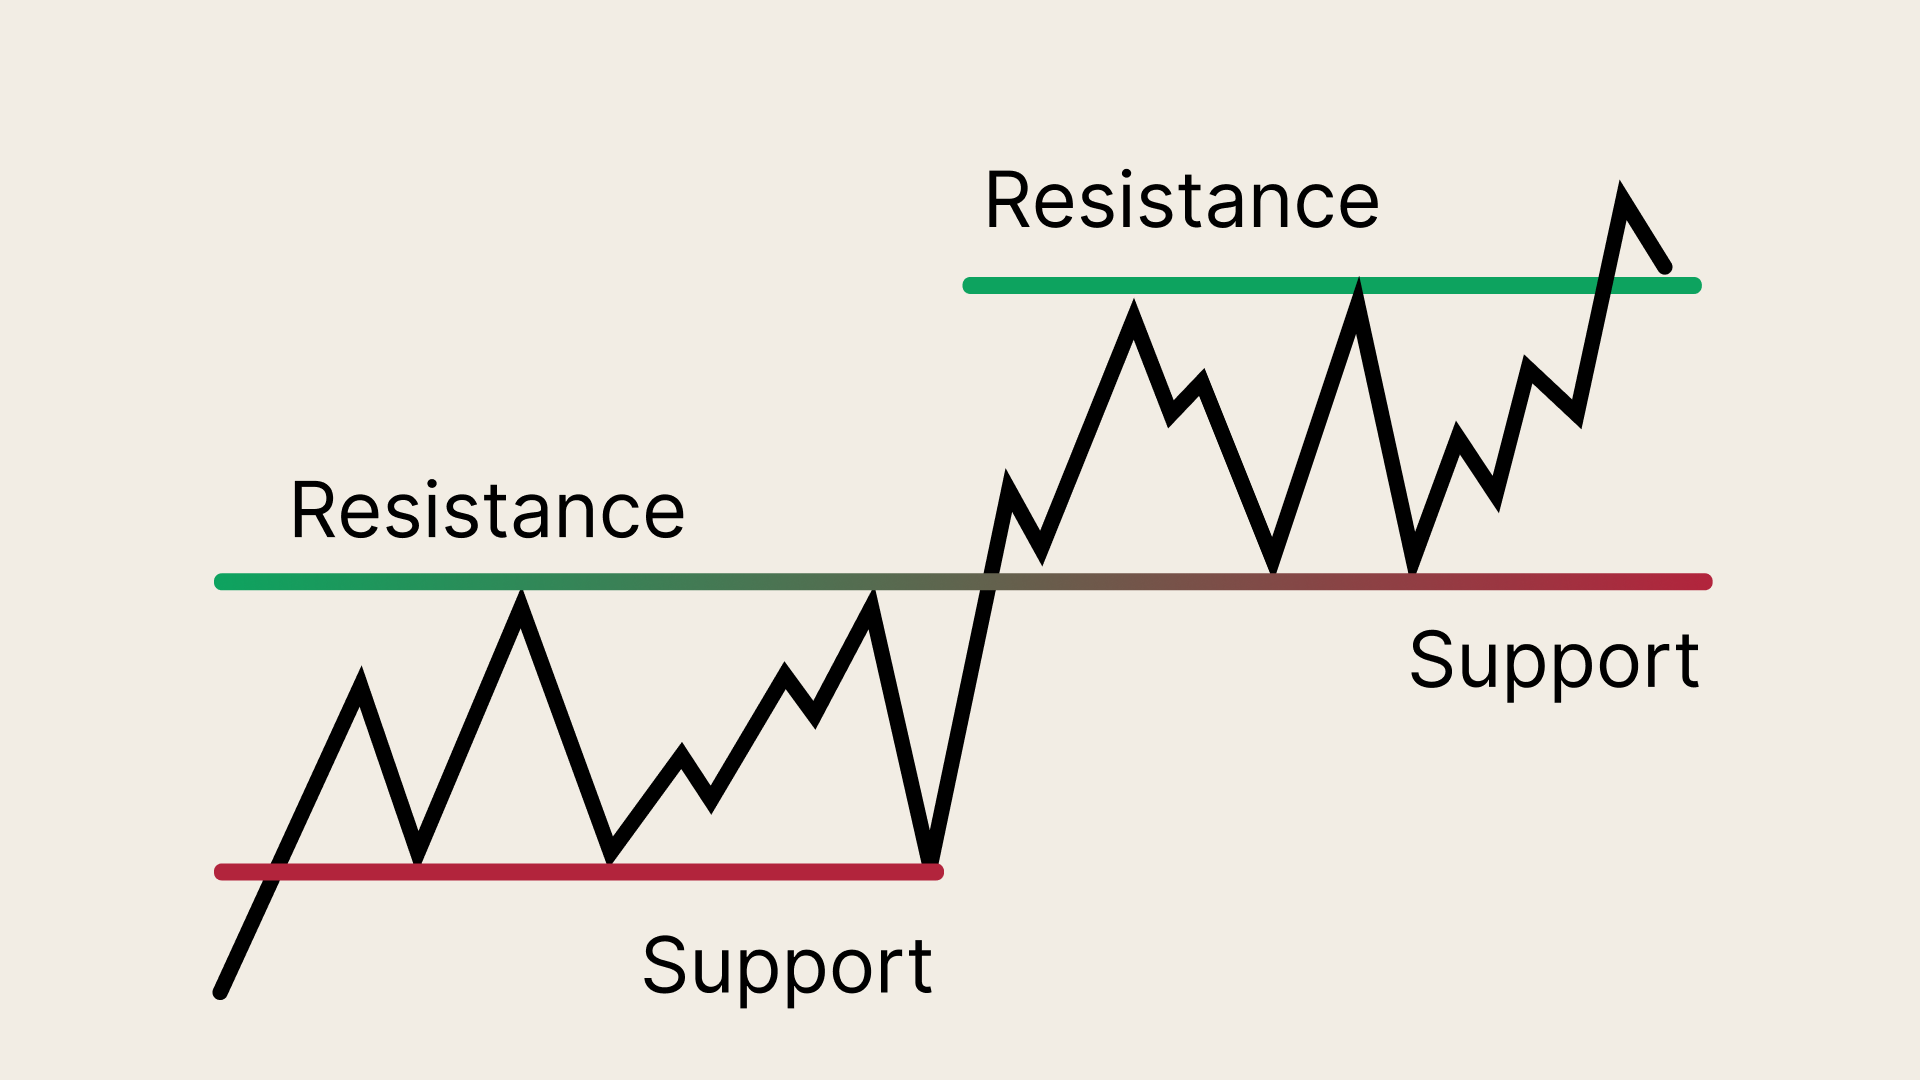
Support is a price level where a downtrend is expected to pause or reverse because buying interest is strong enough to overcome selling pressure.
Resistance is a price level where an uptrend is expected to pause or reverse because selling interest overcomes buying pressure.
Think of support as a “floor” and resistance as a “ceiling” for price. Markets constantly test these invisible boundaries created by collective human psychology.
Once price breaks through a level, the role often reverses: broken support can become resistance, and broken resistance can become support (this is called “Role Reversal”).
Why Do Support and Resistance Work?
These levels work primarily because of market psychology and supply & demand:
- Many traders place buy orders near the exact same support level, creating a massive pocket of liquidity.
- Stop-loss orders naturally cluster above resistance and below support.
- Previous market highs and lows act as psychological anchors for traders worldwide.
- Institutional algorithms and large players actively monitor and respect these exact zones.
How to Identify Support and Resistance Levels
- Swing Highs and Lows — Look for previous peaks (resistance) and troughs (support) where price previously rejected.
- Horizontal Lines — Draw straight lines connecting multiple touches across the chart history.
- Round Numbers — Psychological levels like $50, $100, 1.2000 in forex, or 4,000 on the S&P 500.
- Moving Averages — Dynamic support and resistance (e.g., the standard 50-day or 200-day moving averages).
- Trendlines — Diagonal support in uptrends or resistance in downtrends.
- Volume Profile — Areas with massive trading volume often act as institutional S&R walls.
Pro Tip: The more times a horizontal level or zone has been tested without breaking, the more attention it commands from the market, making the eventual breakout or bounce even more powerful.
Types of Support and Resistance
- Horizontal (Static): Classic straight price levels that remain fixed on your chart.
- Dynamic: Moving averages, trendlines, or Fibonacci levels that adjust and shift over time.
- Psychological: Major round numbers and historical financial milestones.
- Minor vs Major: Minor levels break easily during high momentum; major levels (backed by higher timeframes) dictate macro market structure.
:max_bytes(150000):strip_icc()/dotdash_Final_Support_and_Resistance_Basics_Aug_2020-04-c728025c35b2472f85ba1f09cf79b32d.jpg)
Trading Strategies Using Support and Resistance
1. Bounce Trading (Reversal Strategy)
- Wait for price to approach a strong support zone and look for confirmation—such as a bullish candlestick pattern or an oversold RSI reading—to enter a long trade.
- Conversely, look to short or take profits near strong overhead resistance ceilings.
2. Breakout Trading
- When price aggressively breaks through a major resistance level accompanied by high volume, it signals a continuation or shift in trend, opening up potential long trades.
- Breaking below support with volume signals aggressive selling pressure.
3. Role Reversal Strategy
- After an asset breaks a major resistance level, patient traders wait for a pullback to retest that exact same level—which now acts as new support—before executing an entry.
4. Confluence (My Preferred Setup) — The absolute strongest setups occur when multiple technical factors overlap. For instance, finding a horizontal support zone that lines up perfectly with a 200-day moving average and prints a bullish engulfing candlestick gives you maximum probability.
Breakouts vs Fakeouts: Protecting Your Capital
Not every breakout is genuine. A fakeout (or whipsaw) happens when price briefly punctures a support or resistance level to trap breakout traders before violently reversing direction.
How to avoid fakeouts:
- Wait for a confirmed candle close beyond the level rather than trading a wick mid-candle.
- Always look for increased volume spikes verifying the breakout.
- Use candlestick confirmation patterns on the retest.
- Exercise extreme caution during high-impact macroeconomic news releases.
Real-World Examples from the Markets
Example 1: Apple (AAPL) Stock In recent market cycles, AAPL repeatedly found heavy buying support near the $220–$225 region. Every time price dipped into this zone, buyers absorbed the selling pressure, creating textbook bounce setups. When it eventually shattered the $250 resistance ceiling, it unlocked a powerful continuation rally.
Example 2: EUR/USD Forex Pair The EUR/USD currency pair famously respects major psychological numbers. For instance, treating 1.0800 as a strict ceiling of resistance. Once momentum built up enough to clear it, that old ceiling flipped into a reliable floor during subsequent pullbacks.
Example 3: Bitcoin & Crypto Markets Digital assets like Bitcoin display massive historical respect for round numbers, such as $30,000 and $60,000 blocks. These psychological boundaries routinely act as battlegrounds where institutional algorithms and retail capital collide.
Common Mistakes Beginners Make
- Cluttering charts by drawing far too many lines everywhere.
- Trading support and resistance in complete isolation without looking for confirmation signals.
- Ignoring higher timeframe contexts (trading a 5-minute S&R level while ignoring the daily trend).
- Placing stop-loss orders directly on the line, getting easily wiped out by routine market noise.
Best Practice: Always start your analysis on higher timeframes (such as the 4-Hour or Daily charts) to map out macro support and resistance zones, then drop down to lower timeframes only when looking for your precise execution triggers.
Key Takeaways
- Support and Resistance are the foundational pillars of clean price action analysis.
- High-quality levels feature multiple historical touches and strong technical confluence.
- Price action consistently reacts at these zones—either bouncing, consolidating, or breaking through.
- Pairing S&R zones with candlestick confirmation patterns is one of the most reliable ways to boost your trade probability.
- Always spend time backtesting and marking levels on historical charts before risking live capital.
Mastering support and resistance will give you an objective, clear framework for analyzing any financial market—whether you are trading stocks, forex, crypto, or futures.
In upcoming posts, we’ll build directly on this foundation with complete, step-by-step price action trading strategies and advanced risk management frameworks.