
Cryptocurrency markets are among the most dynamic and volatile trading environments available. Unlike traditional markets, crypto trades 24/7 with no closing bell, leading to rapid price movements driven by news, social sentiment, whale activity, and global events.
Technical analysis (TA) is particularly powerful in crypto because price action often reflects crowd psychology in its purest form. In this guide, we’ll cover the fundamentals of crypto technical analysis, key tools that work well, and practical tips to get started.
Important Disclaimer: Trading cryptocurrencies involves substantial risk of loss and is highly speculative. This article is for educational purposes only and does not constitute financial advice. Never invest more than you can afford to lose.
My Personal Confession: Chasing FOMO, Mining with GPUs, and Learning Crypto the Hard Way
If I’m being entirely transparent, my journey into crypto didn’t start with a clean, calculated trading plan. Like many others, I got FOMO’ed into the space by massive, headline-grabbing gains. Back in the day, I even spent time mining crypto using my GPU, watching the rig hum away while hoping for the next big breakout. I’ve spent years actively trading, and while I have a solid understanding of how the markets move—often finding my footing easier in traditional stocks—crypto has frequently felt like a different beast.
Lately, the landscape has shifted. With the massive institutional capital and excitement flowing into AI stocks, crypto has sometimes felt less interesting or harder to read. Compounding that is the brutal reality of the crypto space: it is an absolute minefield of scams, bad actors, and predatory projects. I’ve been a victim to some of those traps myself in the past, losing funds to things that looked completely legit on the surface. That painful experience taught me the golden rule of this market: always do your own thorough research (DYOR), trust your technical systems, and never trust anyone promising overnight riches. Crypto rewards discipline, but it punishes negligence instantly.
Why Crypto Technical Analysis is Unique
Crypto markets have distinct characteristics that affect how we apply technical analysis:
- 24/7 Trading: No overnight gaps in the traditional sense, but sharp moves can occur anytime.
- High Volatility: Daily swings of 5–15% are common, even for major coins like Bitcoin and Ethereum.
- Strong Influence of Sentiment: News, tweets, and social media can override technical levels quickly.
- Liquidity Variations: Bitcoin and Ethereum are highly liquid, while many altcoins are prone to manipulation and scams.
- Market Cycles: Crypto tends to follow 4-year halving cycles, creating powerful bull and bear markets.
Despite these differences, core technical principles (support/resistance, trends, momentum) still work very effectively.
Core Technical Analysis Tools for Crypto
1. Support and Resistance + Trendlines
These form the foundation. In crypto, round numbers (e.g., $60,000 for Bitcoin) often act as strong psychological support/resistance.
2. Moving Averages (SMA & EMA)
- 50 and 200-period MAs are widely watched.
- Golden Cross (50 above 200) and Death Cross are major signals in crypto.
- EMA 9 and 21 are popular for short-term entries.
3. RSI (Relative Strength Index)
- Crypto frequently reaches extreme overbought (>80) or oversold (<20) levels due to volatility.
- Divergences work especially well for spotting reversals.
4. MACD
Excellent for spotting momentum shifts in trending crypto markets.
5. Fibonacci Retracement
Very popular in crypto for measuring pullbacks during strong trends (61.8% level is particularly respected).
6. Volume Analysis
Look for increasing volume on breakouts. Low volume breakouts are often fakeouts.
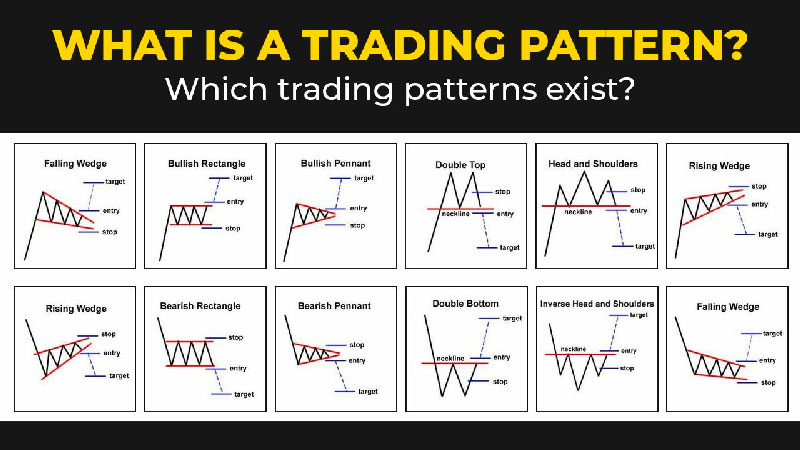
7. Chart Patterns
- Head & Shoulders, Double Tops/Bottoms, Flags, and Triangles appear frequently.
- Ascending/Descending triangles are common during accumulation phases.
Basic Crypto Trading Strategies Using TA
Strategy 1: Trend Following Pullback
- Identify the dominant trend on the Daily or 4H chart (price above 200 EMA = bullish).
- Wait for a pullback to a key support zone (Fibonacci 50% or 61.8%, or moving average).
- Enter on bullish candlestick confirmation + RSI oversold.
Strategy 2: Breakout Trading
- Wait for consolidation near resistance/support.
- Enter on strong breakout with significantly higher than average volume.
- Place stop below the consolidation range.
Strategy 3: Multiple Timeframe Confluence
- Higher timeframe (Daily/Weekly) for direction.
- Lower timeframe (1H/4H) for precise entry.
Real-World Examples
Bitcoin Example: Bitcoin pulled back from major highs to the 61.8% Fibonacci level, which coincided with the 200-day moving average and strong historical support. A bullish engulfing candle with rising volume signaled a high-probability long entry, leading to a strong recovery rally.
Ethereum Example: ETH formed a clear inverse Head & Shoulders pattern on the daily chart near structural support. The neckline breakout on high volume led to a sharp rally in the following weeks.
Altcoin Caution: Many altcoins show beautiful technical setups but fail due to low liquidity or scams. Stick primarily to top-tier assets where technical integrity is much higher.
Common Mistakes in Crypto Technical Analysis
- Ignoring the bigger picture (trading against the 4-year cycle)
- Using tight stops in a highly volatile market
- Over-relying on indicators without price action context
- FOMO buying during parabolic moves
- Trading low-liquidity altcoins or unverified tokens
- Neglecting on-chain metrics and fundamental developments
Risk Management in Crypto Trading
Crypto demands stricter risk management than traditional markets:
- Risk only 0.5–1% of your account per trade (crypto is riskier)
- Use wider stops or ATR-based stops
- Avoid over-leveraged trading on futures (common trap for beginners)
- Diversify across major coins (BTC/ETH) rather than chasing speculative altcoins
- Keep a detailed trading journal including emotions and news context
Key Takeaways
- Technical analysis works very well in crypto, but you must adapt it to the market’s high volatility and 24/7 nature.
- Focus exclusively on major coins (Bitcoin and Ethereum) to avoid scams and low liquidity traps.
- Always combine multiple tools: price action, support/resistance, moving averages, RSI, volume, and multiple timeframes.
- Respect the larger market cycle — trading with the trend dramatically improves your odds.
- Always do your own research (DYOR) and never invest based purely on social media hype.
- Master risk management and trading psychology before scaling up your capital.
Crypto technical analysis builds naturally on everything you’ve learned in this blog series — from candlesticks and moving averages to support/resistance, chart patterns, and trading psychology. The same principles apply, but with extra caution due to the market’s volatility and risks.
In future posts, we’ll explore more advanced crypto-specific topics, such as on-chain analysis basics and market cycle tracking!