Technical Analysis vs Fundamental Analysis: Which One Should You Use?
When you start trading or investing, one of the first big questions you’ll face is: Should I use Technical Analysis or Fundamental Analysis?
Both approaches are powerful, but they look at the market through completely different lenses. Many successful traders and investors actually experiment with both. In this guide, we’ll break down what each method is, my personal take on how they compare in the real world, and how to choose the right style for your lifestyle and goals.
Important Disclaimer: Trading involves substantial risk of loss. This article is for educational purposes only and is not financial advice.
My Perspective: Real-World Experience and Lifestyle
Over the years, I have tried both technical and fundamental styles, and I’ve had success with both. However, through trial and error, I’ve learned a major lesson regarding lifestyle: Fundamental investing is way easier if you have a regular job and not enough time on your hands to stare at charts all day.
Technical analysis requires active screen time, quick decision-making, and constant monitoring of price action. If you are working a 9-to-5 job, sitting in front of a monitor trying to scalp or day-trade charts is a recipe for burnout and costly mistakes. Fundamental investing, on the other hand, allows you to research a company’s financial health, check valuation metrics, and check back weeks or months later without panicking over every 5-minute candle.
What is Technical Analysis?
Technical Analysis focuses entirely on price action, volume, and market psychology using charts, patterns, and indicators. It asks the question: “What are buyers and sellers currently doing on the chart?”
Example: Basic Technical Chart View
Here is a clean daily chart showing raw price movement.
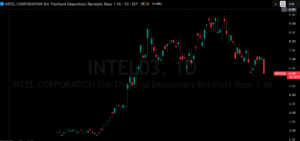
Image 1: A clean daily technical chart (INTEL03). Technical analysis focuses on reading these candlestick structures, identifying trends, and timing entries or exits based on market psychology rather than company financials.
-
Key Focus Areas:
-
Price charts and candlestick formations
-
Technical indicators (Moving Averages, RSI, Volume profiles)
-
Support and resistance levels
-
-
Best For: Day traders, swing traders, and full-time market participants who have the screen time required to manage active positions.
-
Pros: Excellent for precise timing; works across all markets.
-
Cons: Requires intense screen time and psychological discipline; vulnerable to false signals.
What is Fundamental Analysis?
Fundamental Analysis involves evaluating the intrinsic value of an asset by looking at economic health, financial statements, and valuation metrics. It asks the question: “Is this business fundamentally strong and fairly priced?”
Example: Fundamental Valuation & Financial Metrics
Here is a look at what fundamental analysis actually looks like in practice—analyzing financial data, market caps, and valuation ratios.
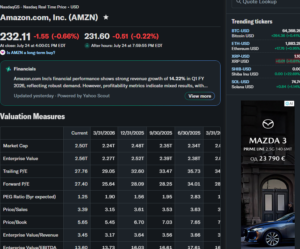
Image 2: A fundamental data dashboard (showing Amazon, AMZN). Instead of looking at candle wicks, fundamental analysis looks at hard financial data like market capitalization, trailing and forward P/E ratios, PEG ratios, and revenue growth to determine long-term value.
-
Key Focus Areas:
-
Company financial statements (revenue, debt, cash flow, earnings growth)
-
Valuation measures (P/E ratio, Price/Book, PEG ratio)
-
Industry trends and competitive advantages
-
-
Best For: Long-term investors, value investors, and working professionals who want to build wealth without being glued to a trading terminal all day.
-
Pros: Less affected by short-term market noise; ideal for busy schedules.
-
Cons: Deep research takes time; does not help with short-term entry/exit timing.
Detailed Comparison: Which Fits Your Life?
| Aspect | Technical Analysis | Fundamental Analysis |
| Time Commitment | High (Requires daily monitoring and screen time) | Low-to-Moderate (Research once, review periodically) |
| Main Data Source | Price charts, volume, and technical indicators | Financial reports, P/E ratios, earnings, and balance sheets |
| Best For | Active day traders, full-time speculators | Working professionals, long-term investors, value buyers |
| Stress Level | High (short-term price swings and execution pressure) | Lower (focuses on long-term business performance) |
| Learning Curve | Steeper (requires pattern recognition and risk math) | Moderate (requires understanding basic corporate finance) |
The “Top-Down” Approach: Combining Both Worlds
Instead of treating these two styles as enemies, the smartest approach is to blend them based on your schedule:
-
Use Fundamentals for Selection: If you have a busy job, use fundamental metrics to screen for strong, growing companies (like checking P/E ratios and revenue health).
-
Use Technicals for Execution: Once you find a company you want to own long-term, pull up a simple daily chart to avoid buying at an obvious short-term peak. Wait for a healthy pullback to support before deploying your capital.
Final Thoughts & Recommendation
There is no single “best” method—the right choice depends entirely on your available time and daily routine.
-
If you are busy with a job or career, fundamental investing gives you the peace of mind to build wealth without sacrificing your daily life.
-
If you have the time and passion for screen time, technical analysis offers exciting opportunities for short-term growth.
Whichever path you choose, always prioritize strict risk management and invest only what you can afford to lose!