Reading Candlestick Patterns: The Ultimate Guide for Precise Entries
Candlestick charts are one of the most popular and powerful tools in technical analysis. Originally developed in Japan over 300 years ago, they provide a visual representation of price movement that is far more informative and intuitive than simple line charts.
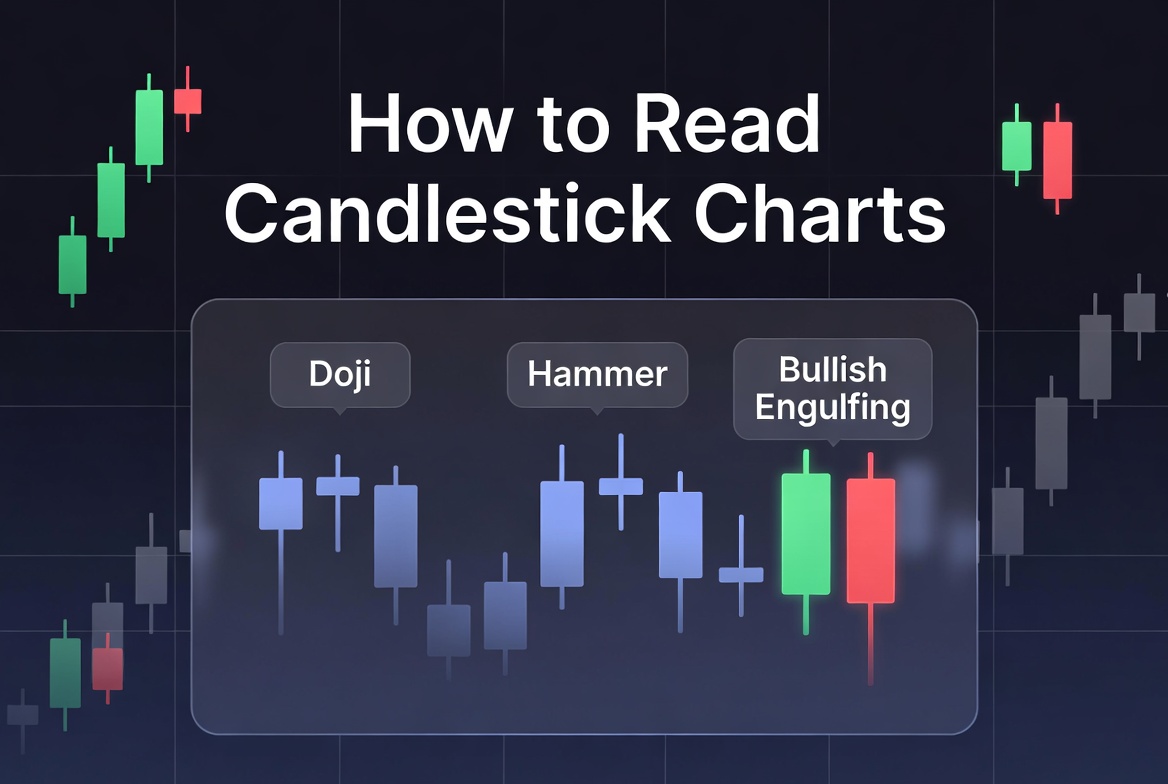
In this beginner-friendly guide, you’ll learn how to read candlestick charts, understand their anatomy, recognize the most common patterns—including Doji, Hammer, and Engulfing patterns—and see why I consider candlestick price action to be the single best confirmation tool for high-probability entries.
Important Disclaimer: Trading involves substantial risk of loss and is not suitable for everyone. This article is for educational purposes only and is not financial advice.
My Perspective: Why Candlestick Patterns Are My Go-To Entry Trigger
Over years of screen time and trading across multiple markets, I’ve tested a lot of indicators and tools. If there is one lesson that stands out above the rest, it is this: Candlestick price action provides the absolute best entry points and gives an amazing final confirmation before risking your capital.
You can map out a support level or draw a trendline all day long, but until the candles actually tell you that buyers or sellers are stepping in, you are just guessing. Candlesticks act as the final trigger. They show you the psychological battle in real-time. When a powerful reversal candle forms at a key level, it dramatically increases your probability of success and keeps you out of premature trades.

Understanding the Basics of Candlestick Charts
Each individual candlestick represents price action over a specific time period (whether that is 1 minute, 1 hour, or 1 daily candle).
A single candlestick consists of four main data points:
-
Open: The price at the beginning of the time period.
-
High: The highest price reached during that period.
-
Low: The lowest price reached during that period.
-
Close: The final price at the end of the period.
-
The Body: The thick rectangular part between the open and close.
-
Green/White body: Close is higher than open (bullish momentum).
-
Red/Black body: Close is lower than open (bearish momentum).
-
-
Wicks / Shadows: The thin lines above and below the body showing the absolute high and low extremes.
Long bodies indicate strong, aggressive buying or selling pressure, while small bodies suggest market hesitation and indecision.
Common Candlestick Patterns Every Trader Should Know
1. The Doji
A Doji forms when the open and close prices are virtually identical, resulting in a very small body with long wicks.
-
What it means: Total market indecision. Buyers and sellers are at equilibrium.
-
Trading Signal: Often appears at the end of an extended trend, signaling a potential reversal or consolidation breakout.
2. Hammer and Inverted Hammer
-
Hammer: Features a small body near the top of the candle with a long lower wick (at least twice the size of the body) and little-to-no upper wick. This shows a strong rejection of lower prices.
-
Inverted Hammer: Features a small body at the bottom with a long upper wick, showing that buyers tried to push higher but were temporarily pushed back down.
-
Best Context: These patterns shine brightest when they appear after a sustained downtrend right at a major support level.
3. Engulfing Patterns
-
Bullish Engulfing: A small red candle immediately followed by a larger green candle that completely “engulfs” the previous body. This signals an aggressive shift from seller control to buyer control.
-
Bearish Engulfing: A small green candle followed by a larger red candle that engulfs it, signaling a sudden shift to seller dominance.
-
Best Context: Highly reliable when forming near key supply and demand zones or major moving averages.

Advanced Context: How Candlesticks Confirm Your Entries
As I mentioned earlier, never trade a candlestick pattern in isolation. Looking at a hammer in the middle of a random chart tells you nothing.
To use candlesticks effectively as entry triggers, you must combine them with proper confluence:
-
Support & Resistance Levels: Let the market drop into a major historical support zone first.
-
Candle Confirmation: Wait for a clear rejection candle (like a Hammer or Bullish Engulfing) to form at that level.
-
Volume & Indicators: Check that volume supports the move and that other indicators (like RSI or moving averages) align.
When these factors line up, the candlestick pattern serves as your final confirmation, giving you a precise entry point with a tight, logical stop-loss.
Real-World Trading Examples
-
Example 1: Bullish Hammer Reversal. After a sharp market decline, an asset forms a classic Hammer candle right at a proven support level. The long lower wick proves that buyers aggressively defended the price.
-
Example 2: Bearish Engulfing at Resistance. On a 4-hour chart following a steady uptrend, a Bearish Engulfing pattern forms right against resistance, offering a high-probability short or exit signal.
-
Example 3: Doji Consolidation. Major assets frequently print Doji candles during consolidation phases at key resistance lines, often preceding explosive breakouts.
How to Practice and Master Chart Reading
If you want to get good at spotting these patterns without risking real money:
-
Open a free TradingView account.
-
Switch your chart view to standard Candlesticks.
-
Study daily charts of major equities or currency pairs.
-
Backtest historical charts to see how price reacted after specific patterns formed.
Key Takeaways
-
Candlesticks reveal the raw psychological battle between buyers and sellers.
-
From my experience, candlestick patterns are the ultimate tool for timing precise entries and confirming market turns.
-
Patterns only work when backed by proper technical context, such as support and resistance levels and strict risk management.
Mastering candlestick charts is a foundational skill that will transform your chart-reading ability and give you the confidence to execute trades cleanly. Keep studying the charts, manage your risk, and treat every trade as a learning experience!