Fibonacci Retracement is one of the most powerful and widely respected tools in technical analysis. Based on the mathematical Fibonacci sequence, these levels often act as precise support and resistance zones where price tends to retrace before continuing in the direction of the main trend.
In this complete guide, you’ll learn what Fibonacci retracements are, the most important levels, how to draw them correctly, and practical strategies for using them in trending markets.
Important Disclaimer: Trading involves substantial risk of loss and is not suitable for everyone. This article is for educational purposes only and does not constitute financial advice. Always use proper risk management and combine tools for better accuracy.
My Personal Perspective: Why Fibonacci Retracements Are on Almost Every Trade I Take
Over years of studying market structures and executing live orders, I’ve found that few tools offer the same level of psychological and mathematical clarity as the Fibonacci retracement. In fact, it has become one of the most used trading tools in my personal arsenal—I utilize it for good confirmation on almost every single trade of my own. When markets pull back in a strong trend, guessing where support will hold is a recipe for disaster; Fibonacci levels provide a objective framework.
This approach isn’t just a personal preference. Legendary market wizards, renowned fund managers, and some of the best professional traders in the business praise Fibonacci analysis for its uncanny ability to pinpoint market turning points. Because millions of institutional algorithms and retail market participants watch these exact mathematical ratios, they often act as self-fulfilling prophecies. From my point of view, combining a clean swing high and low with a 61.8% golden ratio confluence gives you a statistical edge that is hard to match with indicators alone.
Understanding Fibonacci Retracement
The Fibonacci sequence is a series of numbers where each number is the sum of the two preceding ones (1, 1, 2, 3, 5, 8, 13, 21, etc.). The key ratios derived from this sequence are used in trading to predict potential retracement levels.
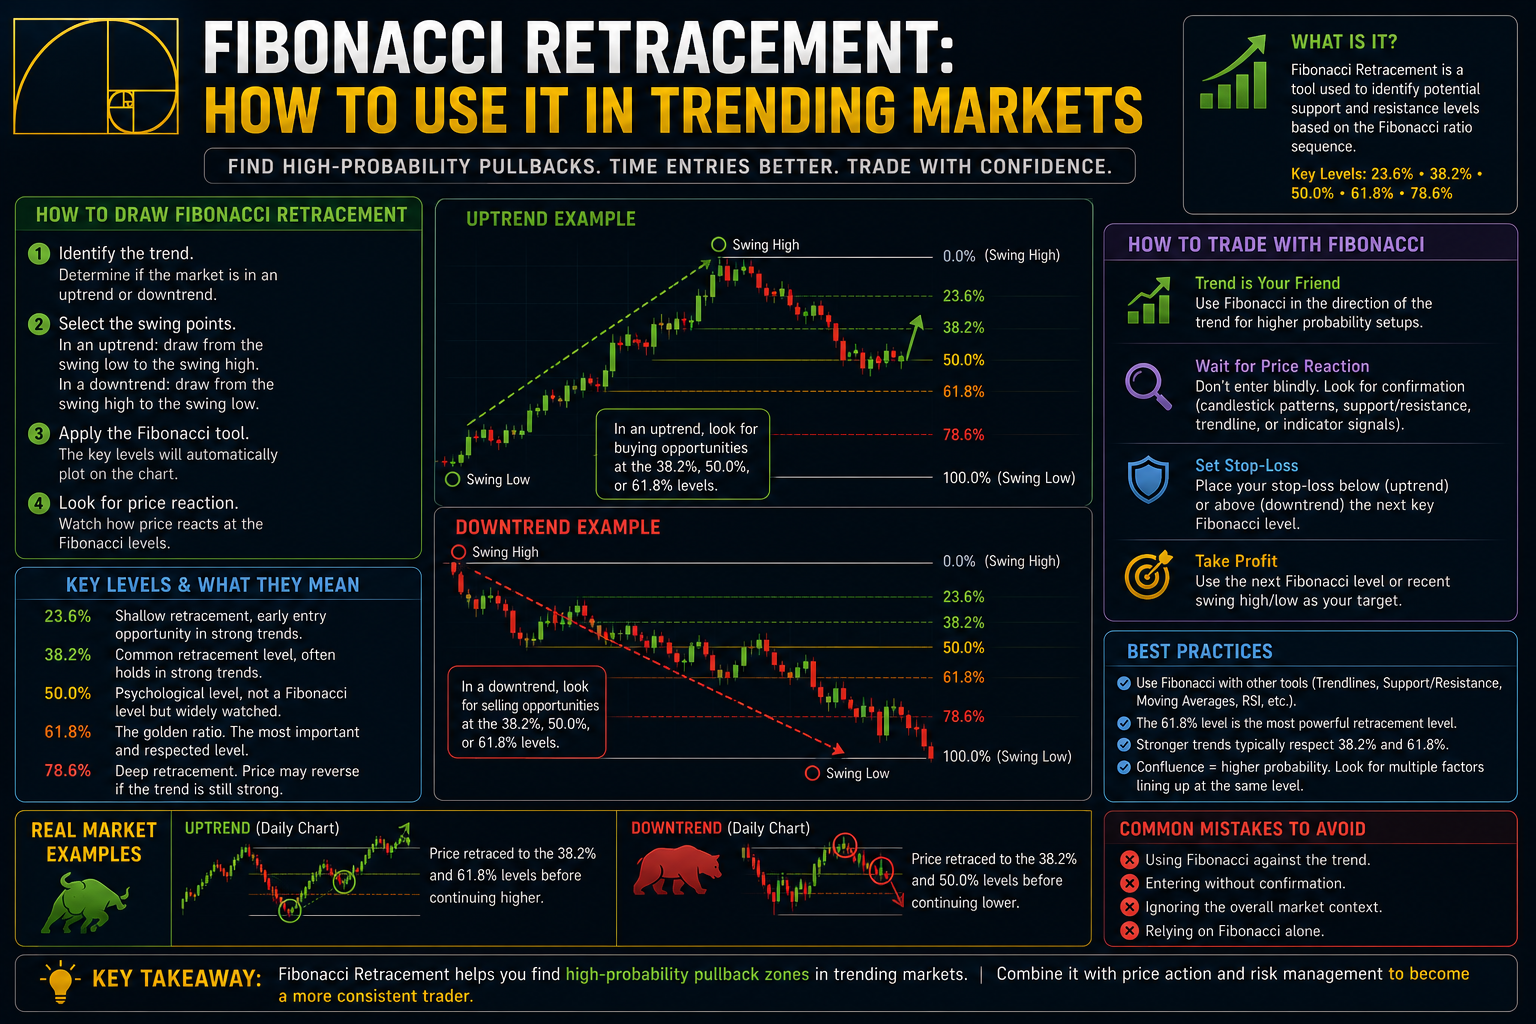
Most Important Fibonacci Retracement Levels:
- 23.6%
- 38.2%
- 50.0% (not a true Fibonacci ratio, but universally respected)
- 61.8% (the “golden ratio” — statistically the most significant)
- 78.6%
- 100% (full retracement of the move)
These percentages represent how much a price move has “retraced” from its recent swing high or low before resuming the primary trend.
How to Draw Fibonacci Retracement Levels
- Identify a strong trend — The tool works best in clear trending markets rather than choppy, sideways conditions.
- Select the swing points correctly:
- In an uptrend: Draw from the Swing Low up to the Swing High.
- In a downtrend: Draw from the Swing High down to the Swing Low.
- Most modern charting platforms (TradingView, MetaTrader, Thinkorswim) have a built-in Fibonacci retracement tool that maps these out automatically once the points are selected.
Pro Tip: Use higher timeframes (such as the Daily or 4-Hour charts) to identify major structural levels, then drop down to lower timeframes for precise entries.
How Fibonacci Works in Trending Markets
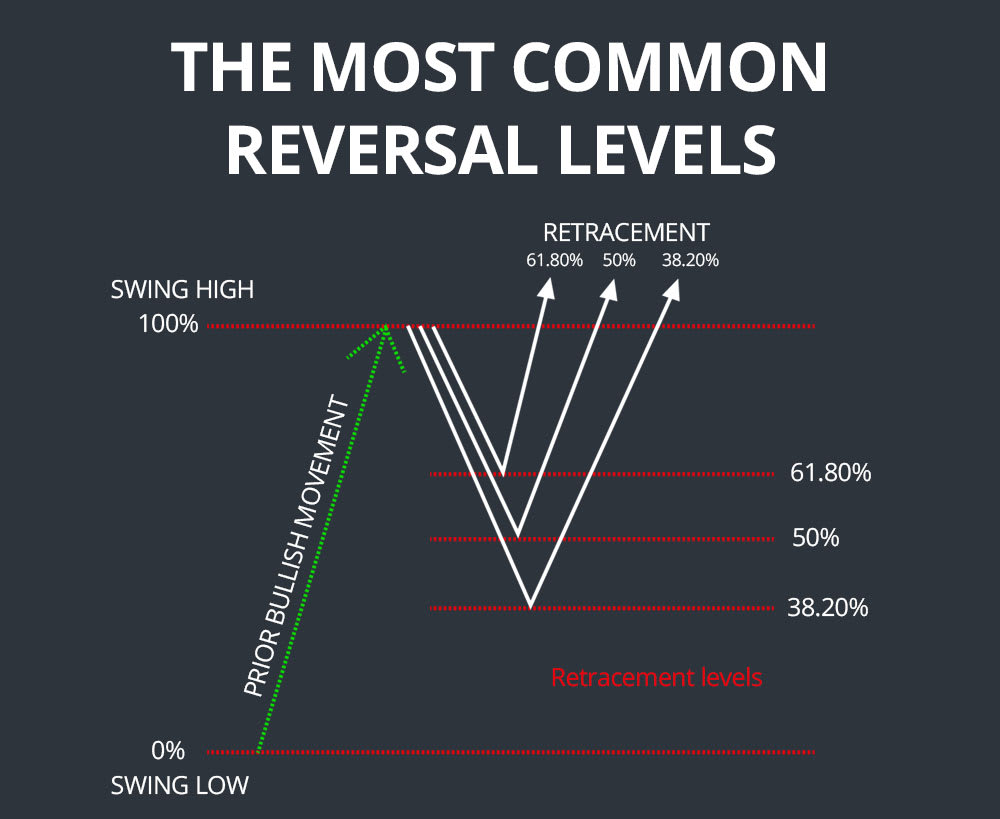
In an uptrend, after a strong impulse move higher, price frequently pulls back to one of the Fibonacci levels before pushing onward. These zones act as dynamic support.
Conversely, in a downtrend, price often retraces to Fibonacci resistance levels before continuing lower.
As seasoned traders frequently note, the 61.8% level is often where the magic happens, followed closely by the 38.2% and 50% lines.
Powerful Trading Strategies Using Fibonacci
1. Pullback Entry Strategy
- Wait patiently for price to retrace into a key Fibonacci zone (especially 38.2%, 50%, or 61.8%).
- Look for confirmation: A bullish candlestick pattern, oversold RSI reading, or moving average bounce.
- Enter the market in the direction of the main trend.
- Place your stop-loss safely below the next Fibonacci level or structural swing low.
2. Confluence Trading (The Highest Probability Setups)
Top traders never rely on a single metric. Combine Fibonacci with other technical tools:
- Fibonacci level + Historical Support/Resistance zone
- Fibonacci level + Moving Average (such as the 50 or 200 EMA)
- Fibonacci level + Candlestick reversal pattern (like a hammer or engulfing candle)
- Fibonacci level + RSI divergence or MACD momentum shift
These multi-indicator confluence zones drastically increase your odds of success.
3. Fibonacci Extensions for Profit Targets
After a successful retracement bounce, use Fibonacci extension levels (such as 127.2%, 161.8%, and 261.8%) to project where the next leg of the trend might exhaust.
Real-World Examples
Example 1: Bitcoin in 2025 Uptrend Bitcoin rallied cleanly from $65,000 to $92,000. It then retraced precisely to the 61.8% Fibonacci level near $75,500, where it printed a bullish hammer candle and bounced aggressively. Traders who entered at this confluence zone captured a massive continuation wave.
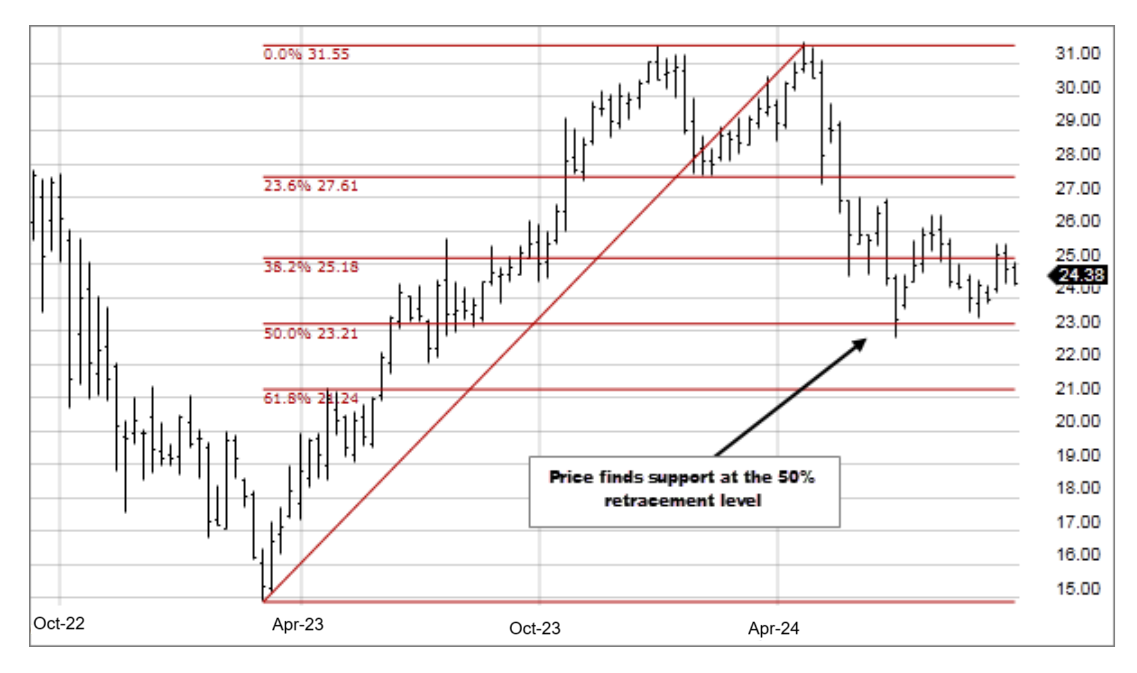
Example 2: Apple (AAPL) Stock During a powerful uptrend, AAPL pulled back to the 50% retracement level, which happened to line up perfectly with the 200-day moving average. This created a textbook high-probability long entry with exceptional risk-reward metrics.
Example 3: EUR/USD Downtrend Following a sharp market decline, EUR/USD retraced to the 38.2% level near overhead resistance. Price rejected the zone with a bearish engulfing pattern, providing a clean short trade that continued lower.
Pros and Cons of Fibonacci Retracement
Pros:
- Applicable across all asset classes (stocks, forex, crypto, and futures)
- Widely respected by institutional players, making it a reliable psychological marker
- Exceptional for finding high-probability pullback entries in trending environments
- Provides clear, mathematical guidelines for stop-loss and take-profit placement
Cons:
- Significantly less effective during choppy, sideways, or low-volatility conditions
- Slightly subjective, as different traders may select marginally different swing points
- Can clutter a chart if too many internal levels are enabled at once
- Never 100% foolproof—always requires technical confirmation
Common Mistakes Beginners Make
- Drawing Fibonacci lines on every minor price wiggle instead of major, impulse trends
- Trading directly against the dominant macro market trend
- Entering positions blindly without price action or indicator confirmation
- Placing stop-losses too tight right against the exact Fibonacci line
- Ignoring the higher timeframe context
Best Practice: Restrict your Fibonacci application to clear trending markets and always wait for structural confirmation before pulling the trigger.
How to Combine Fibonacci with Previous Tools
- With Support & Resistance: Major Fib levels matching historical structural zones offer supreme accuracy.
- With Moving Averages: Pairing a 61.8% retracement with the 50 or 200 EMA builds a powerhouse setup.
- With RSI: Finding an oversold RSI reading right at a key Fib level signals a high-probability bounce.
- With Candlesticks: Always demand a candlestick reversal pattern before entering off a Fib level.
- With MACD: Look for histogram momentum shifts or divergences at key Fib retracements.
Key Takeaways
- Fibonacci Retracement is an essential tool for mapping out support and resistance in trending markets.
- The 61.8% golden ratio, 50%, and 38.2% levels remain the most critical benchmarks for traders.
- Always anchor your drawings from major swing points and trade in alignment with the broader trend.
- Confluence is king—combining Fibonacci with other technical indicators maximizes your edge.
- Log every trade meticulously in your trading journal and maintain strict risk management (1–2% per trade).
Mastering Fibonacci retracements gives you a mathematical advantage when executing pullbacks in strong trends. Tied together with the foundational skills from our previous guides—Support & Resistance, Moving Averages, RSI, MACD, and Candlesticks—you now possess a professional-grade technical analysis toolkit.
In future articles, we’ll explore advanced Fibonacci extensions, chart patterns, and complete end-to-end trading strategies!