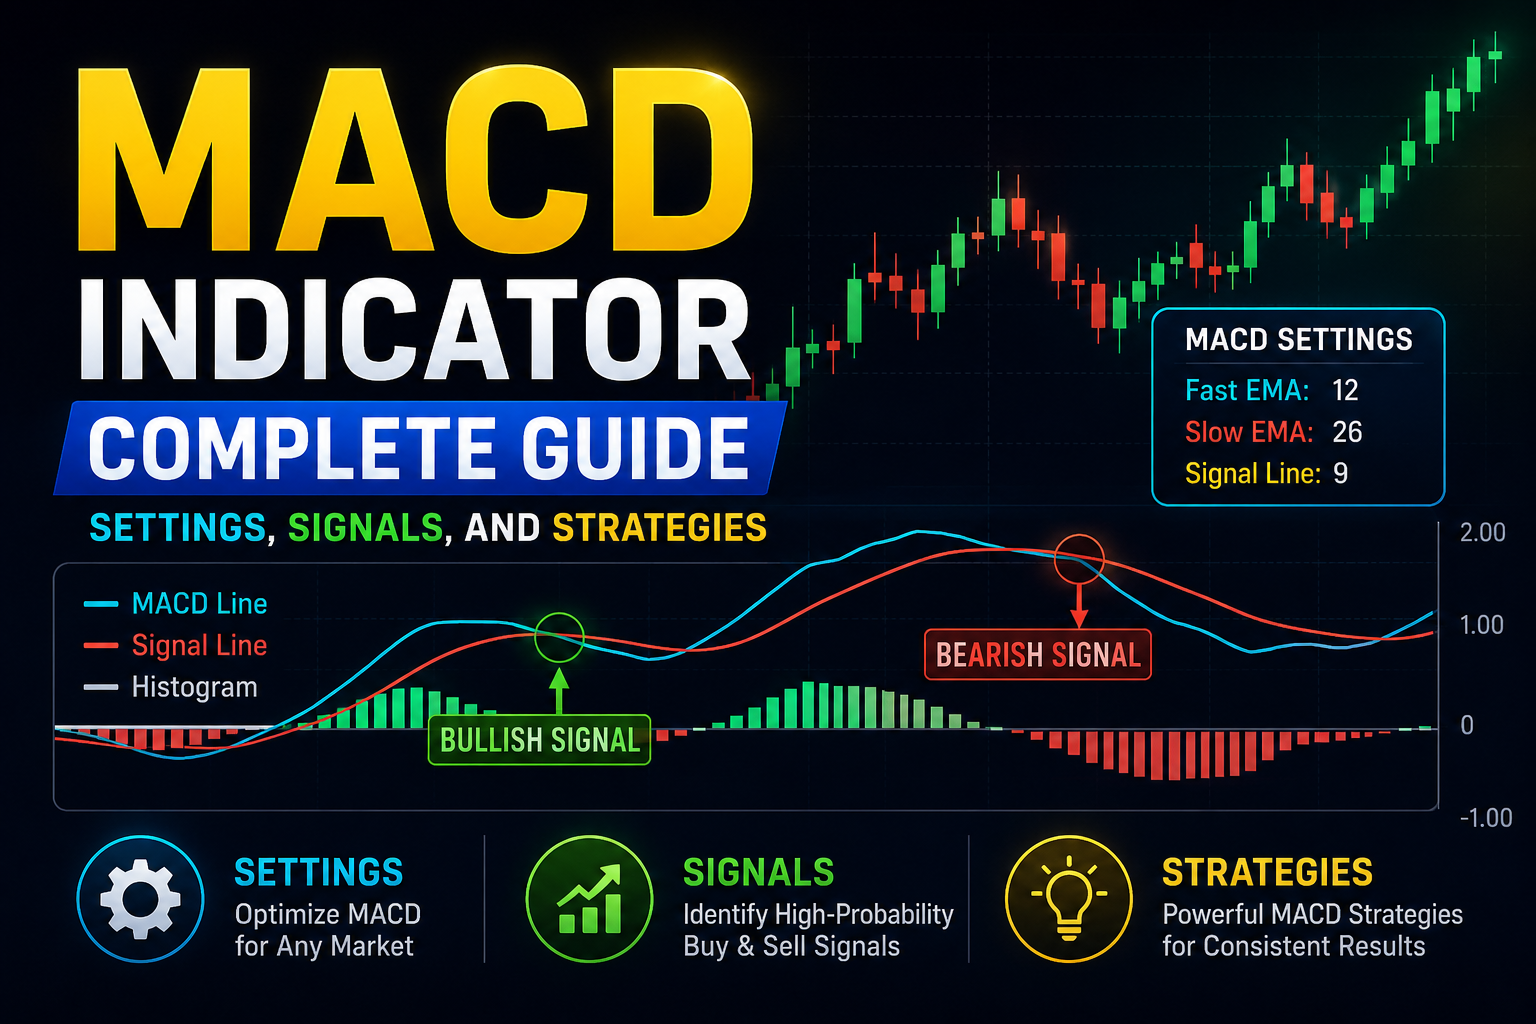
The Moving Average Convergence Divergence (MACD) is one of the most popular and versatile technical indicators in trading. Created by Gerald Appel in the late 1970s, the MACD helps traders identify changes in momentum, trend direction, and potential reversals.
In this complete guide, you’ll learn exactly how the MACD works, the best settings, key trading signals, and practical strategies you can start using immediately.
Important Disclaimer: Trading involves substantial risk of loss and is not suitable for everyone. This article is for educational purposes only and does not constitute financial advice. Always combine indicators with proper risk management and test strategies on a demo account first.
My Personal Perspective: The Reality of MACD and Momentum Lag
Over the course of my trading journey, I’ve incorporated the MACD into many of my strategies, particularly when analyzing broader market momentum. However, just like the RSI and moving averages, it is crucial to recognize a fundamental reality: the MACD is a lagging indicator because it is entirely derived from moving averages of past price data. Because of this lag, relying solely on a basic MACD crossover in a choppy or sideways market can lead to frequent whipsaws and false signals.
As seasoned traders and market legends often point out, no indicator tells the whole story on its own. From my point of view, the MACD is most powerful when used as a macro-momentum filter rather than a standalone trigger. I prefer to pair it directly with structural tools like support and resistance levels, price action candlestick patterns, and volume confirmation. When a major trend alignment occurs alongside a clear MACD divergence or histogram shift at a key technical level, that confluence provides the high-probability edge necessary for consistent trading.
What is the MACD Indicator?
The MACD is a trend-following momentum indicator that shows the relationship between two moving averages of an asset’s price.
It consists of three main components:
- MACD Line — The difference between a 12-period EMA and a 26-period EMA.
- Signal Line — A 9-period EMA of the MACD Line.
- Histogram — The visual difference between the MACD Line and the Signal Line.
When the MACD Line is above the Signal Line, it indicates bullish momentum. When below, it shows bearish momentum.
Default MACD Settings and Variations
Standard Settings: 12, 26, 9
- 12-period EMA (faster component)
- 26-period EMA (slower component)
- 9-period Signal Line
Popular Variations:
- Fast Settings (utilized by some active day traders): 5, 35, 5 or 8, 17, 9
- Slow Settings (favored by longer-term swing traders and investors): 19, 39, 9
- Conservative Baseline: 12, 26, 9 remains the industry standard and most reliable setting for the vast majority of market participants.
Tip: Avoid curve-fitting or constantly tinkering with your settings. Sticking to the default 12, 26, 9 allows you to master how the indicator behaves across different market conditions without second-guessing your analysis.
Key MACD Signals
1. MACD Line Crossovers
- Bullish Crossover: MACD Line crosses above the Signal Line → Potential buy signal.
- Bearish Crossover: MACD Line crosses below the Signal Line → Potential sell signal.
2. Centerline Crossovers (Zero Line)
- MACD crossing above zero = Macro bullish momentum shift.
- MACD crossing below zero = Macro bearish momentum shift.
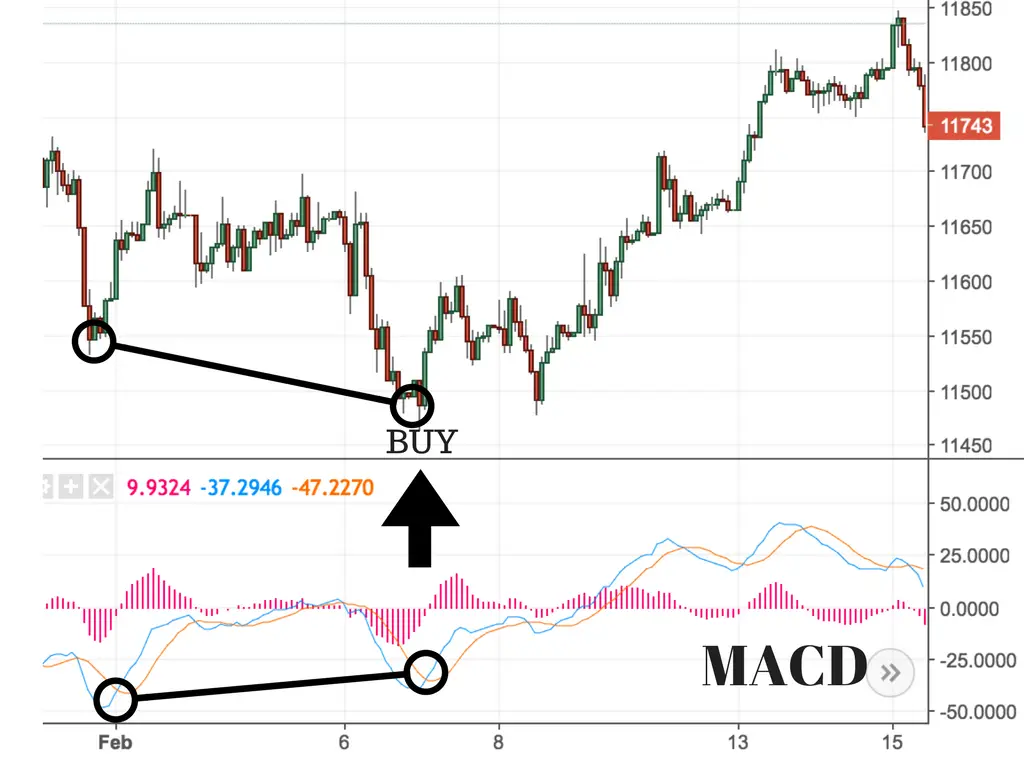
3. MACD Divergence (One of the Strongest Signals)
- Bullish Divergence: Price makes lower lows, but MACD makes higher lows → Strong underlying reversal warning.
- Bearish Divergence: Price makes higher highs, but MACD makes lower highs → Potential exhaustion top.
4. Histogram Analysis
- Rising histogram bars = Expanding momentum.
- Falling histogram bars = Contracting momentum.
- Histogram flipping from negative to positive (or vice versa) often acts as an early warning sign that precedes the actual line crossovers.
Practical MACD Trading Strategies
Strategy 1: MACD Crossover + Trend Filter
- Only take bullish crossovers when price is safely trading above the 200-day EMA.
- Only take bearish crossovers when price is below the 200-day EMA.
- This filter dramatically cuts down false signals during choppy, ranging market environments.
Strategy 2: MACD Divergence Trading
- Look for structural divergences specifically at major historical support or resistance zones.
- Confirm the setup with candlestick rejection patterns or RSI oversold/overbought readings.
- Always pair the entry with a strict risk-reward ratio (targeting a minimum of 1:2).
Strategy 3: Histogram Momentum Reversal
- Enter long when histogram bars start expanding upward after bottoming out in negative territory.
- Enter short when histogram bars start expanding downward after peaking in positive territory.
Strategy 4: Multiple Timeframe MACD Alignment
- Use Daily or 4-Hour charts to establish the macro trend direction.
- Drop down to lower timeframes (like the 1-Hour chart) to fine-tune your entry timing based on minor MACD crosses.
Real-World Examples
Example 1: Bitcoin Daily Chart In recent market cycles, Bitcoin formed a clear bullish MACD divergence while price was testing a major multi-week support zone. The MACD line crossed above the signal line shortly after, paving the way for a strong multi-week relief rally.
Example 2: Apple (AAPL) Stock During a steady uptrend, AAPL’s MACD crossed below the signal line while price hovered near structural resistance. This warned of short-term exhaustion, allowing disciplined traders to lock in profits or sidestep subsequent pullbacks.
Example 3: EUR/USD 4H Chart A bearish MACD centerline crossover combined with price rejecting overhead resistance provided a high-probability short setup backed by clean technical confluence.
Pros and Cons of the MACD Indicator
Pros:
- Clean and easy to interpret visually on any charting platform
- Performs exceptionally well during strong, sustained trending markets
- Provides early insight into shifting momentum dynamics
- Versatile across stocks, forex, cryptocurrency, and futures
- Useful for identifying both trade entries and exit zones
Cons:
- Prone to generating whipsaws and false signals during sideways or ranging phases
- Inherently lags price action due to its moving average foundation
- Divergences can occasionally appear too early before a trend actually turns
- Demands confirmation from external technical tools
Common Mistakes When Using MACD
- Taking every single line crossover blindly without checking the overarching trend context
- Ignoring powerful divergences because they occur against the immediate short-term price move
- Over-relying on the MACD indicator in total isolation
- Constantly changing indicator parameters instead of mastering standard settings
- Trading directly against the dominant higher-timeframe trend
Pro Tip: Combine the MACD with the foundational techniques you’ve learned throughout this series—Support & Resistance levels, Candlestick confirmation patterns, Moving Averages, and the RSI—to build a bulletproof trading system.
Best Practices for Using MACD
- Always analyze MACD within the context of raw price action and structural levels.
- Prioritize higher timeframe signals over noisy lower timeframe fluctuations.
- Log all your MACD-based trades meticulously in your trading journal.
- Backtest your specific strategy rules on historical data before committing real capital.
- Maintain ironclad risk management, risking no more than 1–2% of your account per trade.
Key Takeaways
- The MACD is a robust momentum indicator that excels at exposing trend changes and shifting market energy.
- The default 12, 26, 9 settings offer the most stable and balanced performance for most trading styles.
- Divergences and histogram momentum analysis often generate the most reliable trading signals.
- MACD achieves peak effectiveness when integrated into a broader multi-indicator trading plan.
- Consistent practice, journaling, and strict emotional discipline are the true keys to trading longevity.
Mastering the MACD, alongside the RSI, Moving Averages, Candlesticks, and Support & Resistance concepts covered previously, gives you a comprehensive technical foundation to analyze and navigate any financial market.
In upcoming articles, we will bring all these pieces together into complete, step-by-step trading strategies and explore advanced execution frameworks!