The Relative Strength Index (RSI) is one of the most popular and powerful momentum oscillators used by traders worldwide. Developed by J. Welles Wilder in 1978, the RSI helps traders identify potential trend reversals by measuring the speed and magnitude of recent price movements.
In this comprehensive beginner’s guide, you’ll learn exactly what the RSI is, how to interpret overbought and oversold conditions, and practical strategies to use it effectively in your trading.

Important Disclaimer: Trading involves substantial risk of loss and is not suitable for everyone. This article is for educational purposes only and does not constitute financial advice. Always combine technical indicators with proper risk management.
My Personal Perspective: Why RSI Needs Confirmation and Other Tools
Over years of tracking charts and executing trades across different asset classes, the Relative Strength Index has become a staple in my analytical toolkit. However, experience teaches you a humbling lesson very quickly: RSI is a lagging indicator because it calculates momentum based on past price action. In strong, aggressive trends, an asset can easily stay “overbought” or “oversold” for weeks, trapping traders who try to short or buy blindly just because the line crossed 70 or 30.
As famous traders and market veterans often emphasize, no single indicator holds the holy grail. Famed market wizards and technical analysts routinely warn against indicator isolation. From my point of view, RSI shines brightest when it is never used alone. I treat it as a confirmation tool—pairing it directly with support and resistance levels, moving averages, and candlestick patterns. When an asset hits a multi-week support zone, prints a bullish reversal candle, *and* shows an RSI divergence or oversold crossover, that confluence creates the high-probability edge you need to succeed.
What is the RSI Indicator?
The RSI is a momentum oscillator that moves between 0 and 100. It compares the magnitude of recent gains to recent losses over a specific period.
Standard Setting: 14 periods (can be applied to any timeframe — 14 days on daily charts, 14 hours on hourly charts, etc.)
RSI Formula (Simplified): RSI = 100 – [100 ÷ (1 + RS)] Where RS (Relative Strength) = Average Gain ÷ Average Loss
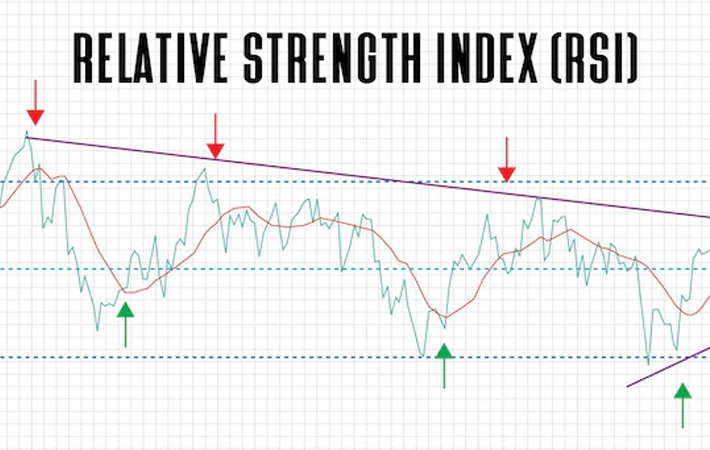
- RSI above 70 = Overbought (potential reversal lower)
- RSI below 30 = Oversold (potential reversal higher)
Understanding Overbought and Oversold Conditions
Overbought (Above 70): The asset has risen too quickly and may be due for a pullback or correction. As veteran traders note, it doesn’t mean the price will fall immediately — strong bull trends can stay overbought for a long time.
Oversold (Below 30): The asset has fallen sharply and may be due for a bounce. Again, in strong downtrends, prices can remain oversold for extended periods.
Important Note: In strong bull markets, RSI often stays between 40–90. In strong bear markets, it may stay between 10–60. Always consider the overall macro trend context.
How to Use RSI for Trading Signals
1. Basic Overbought/Oversold Strategy
- Buy when RSI crosses above 30 from oversold territory (ideally with price confirmation)
- Sell/Short when RSI crosses below 70 from overbought territory
2. RSI Divergence (Powerful Reversal Signal)
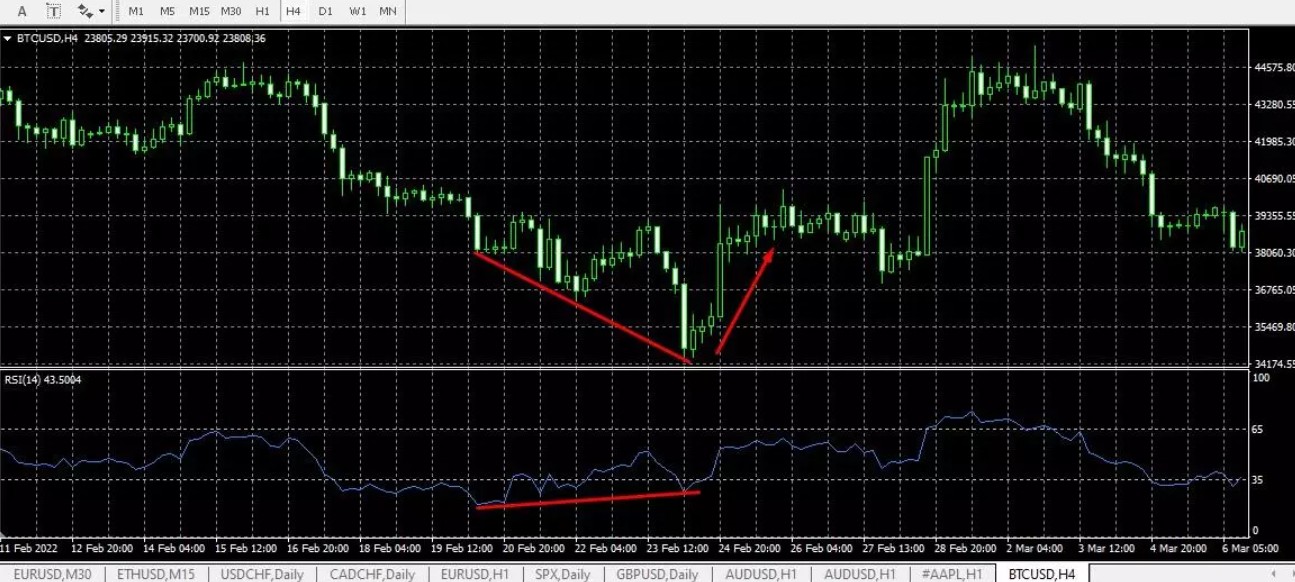
- Bullish Divergence: Price makes lower lows, but RSI makes higher lows → Potential upward reversal.
- Bearish Divergence: Price makes higher highs, but RSI makes lower highs → Potential downward reversal.
Divergences are among the strongest RSI signals when they occur at key support or resistance levels.
3. RSI Centerline Crossovers
- RSI crossing above 50 = Bullish momentum shift
- RSI crossing below 50 = Bearish momentum shift
4. Failure Swings
- Bullish Failure Swing: RSI falls below 30, rises, pulls back (without breaking previous low), then breaks the previous high.
- Bearish Failure Swing: The exact opposite pattern.
Best RSI Settings and Timeframes
| Trading Style | Recommended RSI Period | Best Timeframe |
|---|---|---|
| Day Trading | 9 or 14 | 5-min / 15-min |
| Swing Trading | 14 | 4-hour / Daily |
| Long-term Investing | 14 or 21 | Daily / Weekly |
Tip: Shorter periods (9–11) are more sensitive and produce more noise. Longer periods (21+) are smoother and filter out false breakouts.
Real-World Examples
Example 1: Bitcoin (BTC) Bullish Divergence In early market cycles, Bitcoin formed a lower low in price while the RSI on the daily chart formed a higher low. This bullish divergence occurred right near a major support level. The price reversed and rallied sharply in the following weeks.
Example 2: Apple (AAPL) Overbought Condition During a strong uptrend, AAPL’s RSI reached 82 on the daily chart. Because RSI lags, the stock continued higher for a few more days before pulling back sharply once RSI crossed below 70, offering a textbook short-term pullback opportunity.
Example 3: EUR/USD Oversold Bounce On a 4-hour chart, EUR/USD dropped into oversold territory (RSI < 28) right into a strong support level. Price formed a bullish engulfing candlestick, and RSI crossed back above 30, yielding a high-probability long trade.
Pros and Cons of Using RSI
Pros:
- Easy to understand and visually clean on any chart
- Works exceptionally well in ranging markets
- Fantastic for spotting momentum divergences
- Can be applied across stocks, forex, crypto, and futures
Cons:
- Can give false signals during powerful, runaway trending markets
- Inherently lags behind price action
- Overbought and oversold thresholds are never absolute guarantees
Common Mistakes When Using RSI
- Trading every single overbought or oversold cross blindly without technical confirmation
- Ignoring the overarching macro market trend
- Using RSI in complete isolation instead of a multi-indicator system
- Constantly changing settings instead of mastering one timeframe
Pro Tip: As legendary traders always advise, risk control and confluence matter more than any indicator. The strongest signals happen when RSI aligns cleanly with support/resistance, volume, and price action patterns.
How to Combine RSI with Other Tools
- With Support/Resistance: Look for oversold RSI readings specifically when price tests major historical support zones.
- With Moving Averages: Use RSI pullbacks to time entries while price stays safely above the 200-day moving average.
- With Candlesticks: Wait for a bullish reversal pattern to print when RSI crosses out of oversold territory.
- With Volume: Confirm momentum shifts with expanding volume spikes.
This multi-layered approach significantly cuts down false signals and improves your win rate.
Key Takeaways
- RSI is a powerful momentum oscillator designed to measure speed and spot extreme market conditions.
- Because it is a lagging indicator, divergences are often much more reliable than basic overbought/oversold crosses.
- Never trade RSI in isolation—always factor in the broader trend and market context.
- Combine RSI with support and resistance, moving averages, and candlestick confirmations for optimal results.
- Log your trades in your journal and practice on a demo account before risking live capital.
Mastering the RSI indicator will give you a valuable edge in spotting potential reversals and managing trade timing effectively, tying together all the foundational skills from our previous guides.
In future posts, we’ll dive into advanced indicators like the MACD and look at complete, end-to-end trading strategies!