While technical analysis focuses on price charts and patterns, fundamental analysis looks at the actual health and value of a company. It answers the question: “Is this business worth investing in?”
Fundamental analysis is especially valuable for long-term investors and swing traders. In this beginner-friendly guide, you’ll learn the most important financial metrics to watch, what they mean, and how to use them to make better trading and investing decisions.
Important Disclaimer: Trading and investing involve substantial risk of loss and is not suitable for everyone. This article is for educational purposes only and does not constitute financial advice. Always do your own research or consult a licensed financial advisor.
My Personal Perspective: Why Fundamentals Drive the Biggest Market Moves
From my experience, fundamental analysis is the absolute best approach for both long-term investing and active trading. While charts show you the footprint, fundamentals are the underlying engine. Stellar earnings reports, major business catalysts, and strong core metrics are ultimately what move prices the most in a profound way.
If you have the time while day trading or swing trading, checking a company’s fundamental standing is critically important to avoid nasty surprises. Meanwhile, for long-term investing, mastering fundamentals is the absolute key to finding proper winners that compound wealth over years. Merging good numbers with market timing gives you a massive edge.
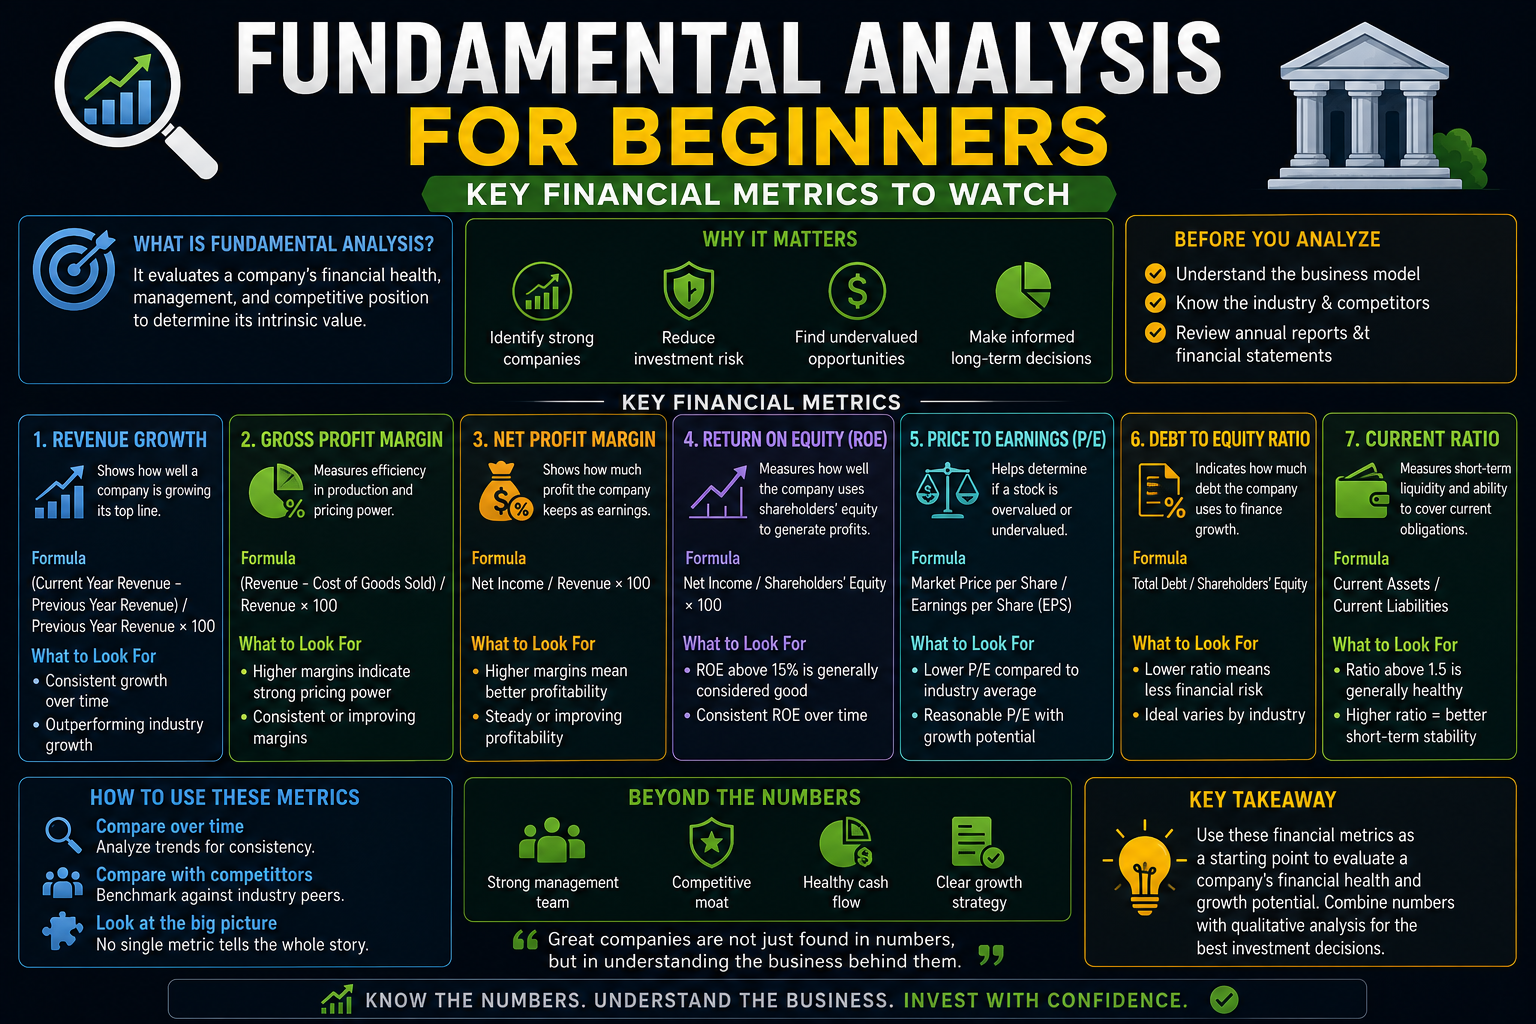
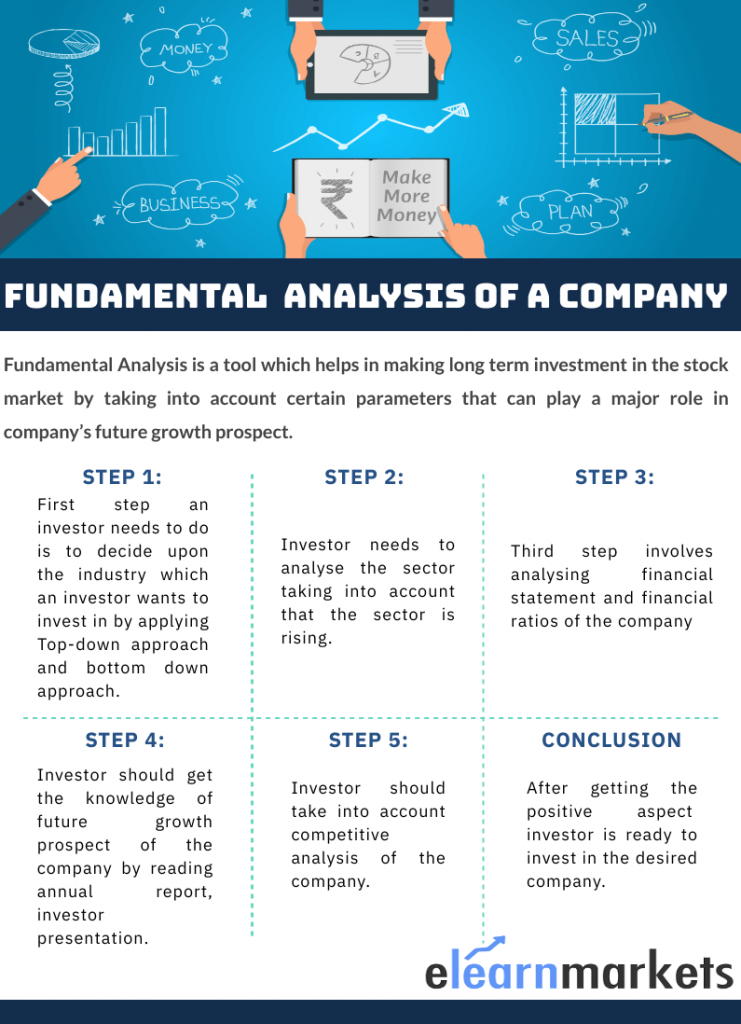
What is Fundamental Analysis?
Fundamental analysis evaluates a company’s intrinsic value by examining financial statements, industry conditions, economic factors, and management quality. The goal is to determine whether a stock is undervalued, overvalued, or fairly priced.
Key sources of information:
- Quarterly and annual earnings reports (10-Q and 10-K filings)
- Company balance sheets and income statements
- Analyst reports, breaking news, and corporate catalysts
Key Financial Metrics Every Beginner Should Know
1. Earnings Per Share (EPS)
What it is: The portion of a company’s profit allocated to each outstanding share of common stock.
Why it matters: Shows how profitable a company is on a per-share basis.
- Rising EPS over time = Good sign of organic growth
- Compare current EPS to previous quarters and past years
Tip: Look for consistent EPS growth rather than isolated one-time spikes.
2. Price-to-Earnings Ratio (P/E Ratio)
What it is: The most popular valuation metric. It shows how much investors are willing to pay per dollar of earnings.
Formula: P/E = Current Stock Price ÷ EPS
Interpretation:
- Low P/E (e.g., under 15) → Potentially undervalued value stock
- High P/E (e.g., over 25–30) → Growth expectations are high, or it might be overvalued
- Compare closely with industry peers and historical averages
Forward P/E uses estimated future earnings, while Trailing P/E uses past audited earnings.
3. Revenue (Sales) Growth
What it is: The total income generated by a company from selling goods or services.
Why it matters: Revenue is the top line of the income statement. Strong, consistent revenue growth usually paves the way for future profit expansion.
What to look for:
- Year-over-year (YoY) revenue growth of 10%+ is generally a healthy sign
- Accelerating growth numbers are a massive positive catalyst
4. Price-to-Book Ratio (P/B)
What it is: Compares the market value of a company to its net book value (assets minus liabilities).
Formula: P/B = Market Price per Share ÷ Book Value per Share
Interpretation:
- P/B below 1 → Trading below its net asset value (potentially undervalued)
- Particularly useful for analyzing banks, real estate firms, and asset-heavy industrial companies
5. Debt-to-Equity Ratio (D/E)
What it is: Measures a company’s financial leverage by comparing total liabilities to shareholders’ equity.
Formula: D/E = Total Liabilities ÷ Shareholders’ Equity
Interpretation:
- Low D/E (< 1) → Conservative, robust balance sheet
- High D/E → Elevated risk, especially vulnerable in rising interest rate environments
6. Return on Equity (ROE)
What it is: Shows how efficiently management uses shareholders’ capital to generate net profits.
Formula: ROE = Net Income ÷ Shareholders’ Equity
Good benchmark: An ROE of 15%+ is widely considered strong for most operating companies.
7. Free Cash Flow (FCF)
What it is: Cash generated by normal operations after accounting for capital expenditures (money available for dividends, stock buybacks, or R&D).
Why it matters: Accounting earnings can sometimes be manipulated, but actual cash flow is far harder to fake. Strong, positive FCF is a major green flag.
8. Dividend Yield (for Income Investors)
What it is: Annual dividend per share divided by the current stock price.
Always target sustainable payouts (payout ratio < 60–70%) rather than artificially inflated, extremely high yields that often trap unsuspecting investors.
Key Metrics Comparison Table
| Metric | What It Measures | Good Signal | Caution Signal |
|---|---|---|---|
| EPS | Profitability per share | Consistent growth | Declining or erratic |
| P/E Ratio | Valuation | Reasonable vs. peers | Extremely high |
| Revenue Growth | Top-line growth | 10%+ YoY | Stagnant or declining |
| P/B Ratio | Asset value | Below 1 or industry average | Very high |
| Debt-to-Equity | Financial health | Below 1 | Above 2 |
| ROE | Efficiency | 15%+ | Below 10% |
| Free Cash Flow | Cash generation | Growing positively | Negative or declining |
.jpg)
Real-World Examples
Example 1: Apple (AAPL) Apple consistently prints robust EPS growth, strong revenue increases, and immense free cash flow. Even with an elevated P/E ratio, long-term investors are happy to pay a premium for its powerhouse brand, ecosystem loyalty, and consistent financial performance.
Example 2: Value Opportunity A stock trading at a modest P/E of 12 with 15% revenue growth, a clean balance sheet, and strong ROE represents an attractive value play compared to over-hyped industry peers trading at P/Es of 25+.
Example 3: Warning Signs A company suffering from shrinking revenue, dangerous debt-to-equity levels, and negative free cash flow should raise major red flags for fundamental investors—even if the declining stock price looks superficially “cheap.”
How to Combine Fundamental and Technical Analysis
The most comprehensive trading approach merges both worlds:
- Use fundamentals to scan and select high-quality companies or booming market sectors.
- Use technical analysis (support/resistance, moving averages, candlesticks, RSI, and volume) to precisely time your market entries and exits.
This top-down synergy bridges the gap between asset quality and trade execution.
Common Mistakes Beginners Make
- Fixating exclusively on a single metric (like blindly chasing a low P/E ratio).
- Ignoring broader industry trends and macroeconomic context.
- Buying high-growth stocks purely on hype without checking underlying valuations.
- Failing to analyze financial trends across multiple quarters.
- Overlooking heavy debt burdens during low-interest-rate cycles.
Pro Tip: Utilize free data platforms like Yahoo Finance, Finviz, or direct company investor relations portals to easily pull these financial metrics.
Key Takeaways
- Fundamental analysis reveals the true underlying business value behind a ticker symbol.
- Focus closely on EPS growth, revenue momentum, P/E valuation, debt ratios, and free cash flow.
- No single metric tells the whole story—always evaluate the complete financial picture.
- Compare companies directly against sector peers and their own historical baselines.
- Blend fundamental research with technical execution for ultimate trading results.
- Practice tracking companies over time inside your trading journal to sharpen your eye.
Mastering these core financial metrics completes your foundational knowledge across both technical and fundamental dimensions. Tied together with past lessons on price action, indicators, volume, and multiple timeframes, you possess a complete framework for reading any market.
In upcoming articles, we’ll break down how to read earnings report releases, analyze macro economic indicators, and master sector rotation strategies!