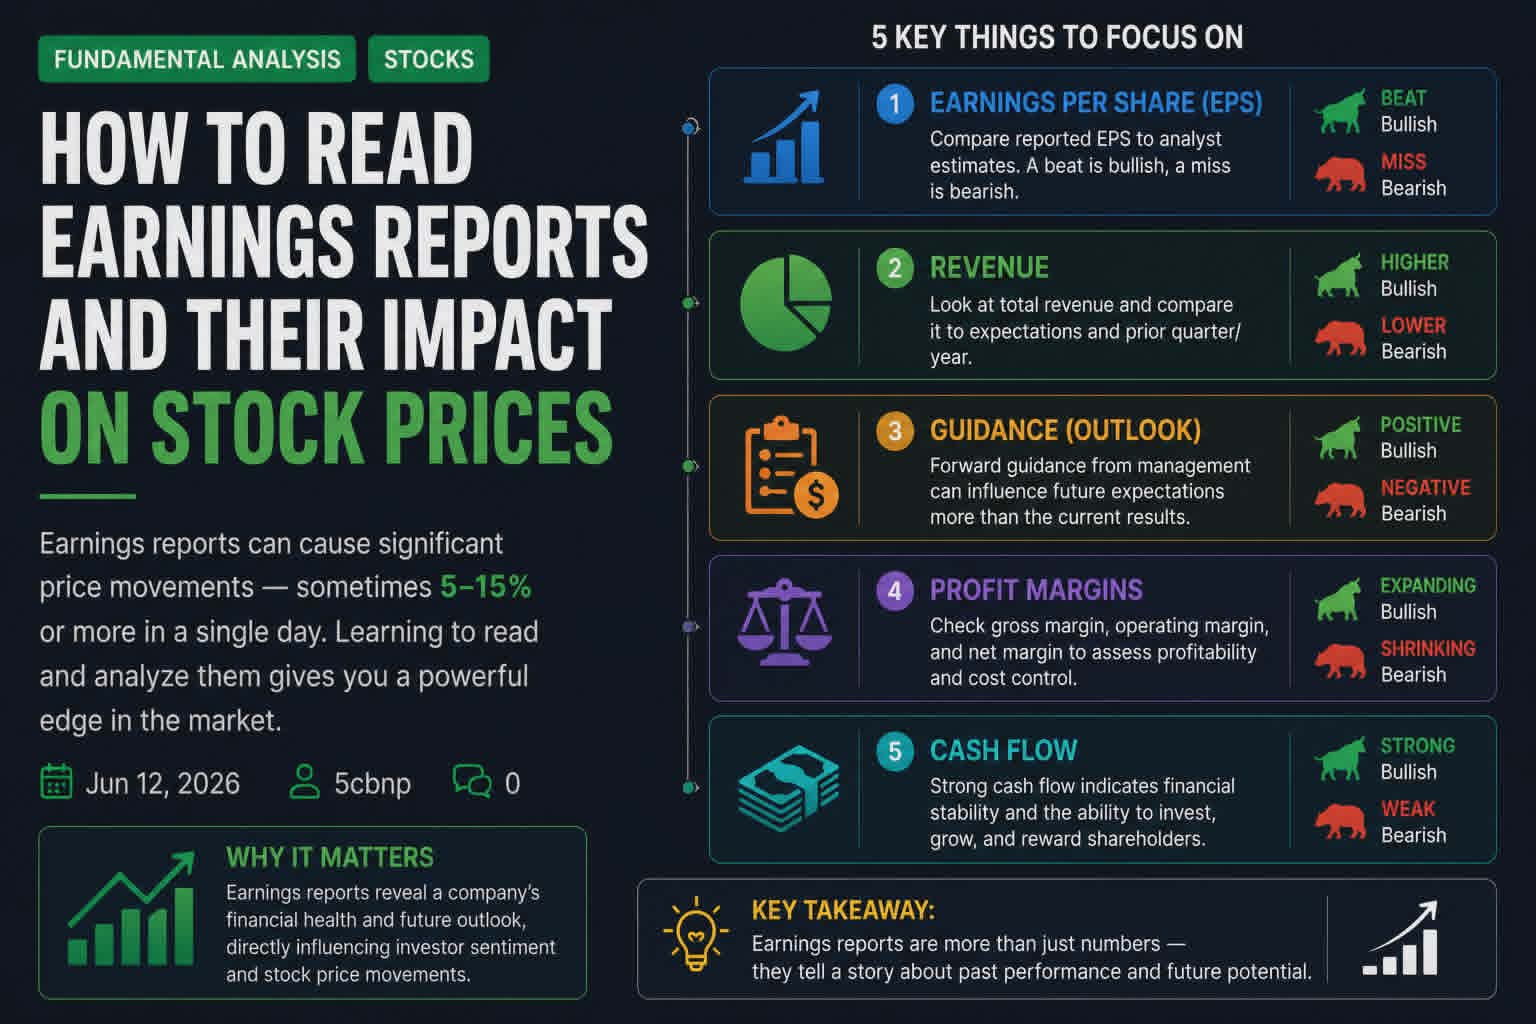
significant price movements — sometimes 5–15% or more in a single day.
Learning to read earnings reports effectively can give you a major edge in both fundamental and technical trading. In this guide, you’ll learn what to look for in an earnings report, how to interpret the key sections, and why the market reacts the way it does.
Important Disclaimer: Trading and investing involve substantial risk of loss and is not suitable for everyone. This article is for educational purposes only and does not constitute financial advice. Always do your own research.
:max_bytes(150000):strip_icc()/ForcesThatMoveStockPrices2-d78bc38c16c743ffa0a8cf63184934a7.png)
My Personal Perspective: Why Earnings Reports Are Key for Picking Winners and Anticipating Volatility
In my experience, digging into earnings reports is the absolute key for picking the right stock, separating elite market winners from the companies quietly burning capital. Reading the proper information is one of the best ways to ensure you understand a business deeply—and more importantly, it allows you to always expect and prepare for massive, explosive volatile moves whether they happen pre-market, after-hours, or live during the trading session.
Because institutional algorithms and professional traders react instantly to top-line figures, unexpected EPS surprises, and forward projections, earnings releases act as the ultimate catalyst. If you learn how to dissect these documents properly, you stop trading blindly and start anticipating where smart money capital is about to flow.
What Are Earnings Reports?
Public companies are required to release financial results every quarter (and a more detailed annual report). These reports contain the company’s revenue, profits, future guidance, and management commentary.
Earnings season typically occurs in January, April, July, and October.
The most anticipated numbers are:
- Earnings Per Share (EPS)
- Revenue
- Guidance for the next quarter/year
How to Read an Earnings Report: Step-by-Step
1. The Earnings Release (Press Release)
This is the first document released. Focus on these key sections:
- Headline Numbers (EPS and Revenue)
- Compare actual results vs. analyst expectations (the “whisper number”)
- Beat = Stock usually rises
- Miss = Stock usually falls
- Year-over-Year (YoY) Growth
- Is revenue and EPS growing compared to the same quarter last year?
- Guidance
- This is often more important than the current quarter’s results. Strong forward guidance can drive big rallies even on a modest beat.
2. Income Statement
- Revenue (Top Line): Shows sales growth.
- Gross Profit & Margins: Indicates pricing power and efficiency.
- Operating Income & Net Income: Shows true profitability after expenses.
- EPS: Bottom-line profit per share.
3. Balance Sheet
- Cash position and debt levels
- Whether the company is strengthening or weakening financially
4. Cash Flow Statement
- Operating cash flow: The real cash the business generates
- Free Cash Flow: Money available for dividends, buybacks, or growth
5. Management Discussion & Analysis (MD&A) and Conference Call
- Listen to the earnings call (or read the transcript). Management tone and commentary on future outlook are crucial.
Why Earnings Move Stock Prices
Markets price in expectations. The real driver of price movement is the surprise factor:
- Beat + Strong Guidance = Sharp rally
- Beat + Weak Guidance = Mixed or negative reaction
- Miss + Poor Guidance = Sharp sell-off
Other factors that influence reaction:
- Overall market sentiment
- Sector performance
- Macroeconomic conditions (interest rates, inflation)
- Previous price trend (stocks in strong uptrends often recover faster from misses)
Key Metrics to Watch Beyond EPS and Revenue
| Metric | What It Shows | Positive Signal | Red Flag |
|---|---|---|---|
| Revenue Growth | Top-line sales | Accelerating YoY growth | Slowing or declining |
| EPS Beat/Miss | Profitability | Consistent beats | Repeated misses |
| Gross Margin | Pricing power & costs | Expanding margins | Shrinking margins |
| Operating Margin | Operational efficiency | Improving | Deteriorating |
| Forward Guidance | Future expectations | Raised guidance | Lowered guidance |
| Free Cash Flow | Cash generation | Strong and growing | Negative or declining |

Real-World Examples
Example 1: Strong Beat & Raise (Positive Reaction) In 2025, NVIDIA reported earnings that beat expectations significantly with raised full-year guidance. The stock surged over 8% in after-hours trading as investors priced in continued AI demand.
Example 2: Beat but Weak Guidance (Negative Reaction) Meta Platforms beat EPS estimates but provided conservative guidance due to higher expected spending. The stock dropped sharply despite the beat, showing that future expectations matter more than past results.
Example 3: Miss & Recovery Tesla missed EPS estimates in a difficult quarter but highlighted strong delivery growth and new product plans. The stock initially sold off but recovered within days as traders focused on the long-term story.
Trading Strategies Around Earnings
- Earnings Play (High Risk): Trade the reaction using options or stocks. Very volatile.
- Post-Earnings Drift: Wait 1–2 days after the initial reaction for the price to stabilize, then trade in the direction of the new trend.
- Avoid Trading During Earnings: Many experienced traders reduce position size or stay out completely during earnings season due to unpredictability.
- Use Technicals + Fundamentals: Check support/resistance and multiple timeframe analysis before and after the report.
Pro Tip: Use tools like Yahoo Finance, EarningsWhispers, or Zacks to see consensus estimates and historical reactions.
Common Mistakes Beginners Make
- Focusing only on EPS without looking at revenue or guidance
- Trading the headline without reading the full report
- Ignoring the bigger picture (industry trends, macro environment)
- Overreacting to one quarter’s results
- Not having a pre-defined plan for earnings trades
Key Takeaways
- Earnings reports are critical events that can cause massive stock moves.
- Always compare actual results to analyst expectations — the surprise is what moves prices.
- Guidance and management commentary often matter more than the current quarter.
- Look at the full picture: revenue growth, margins, cash flow, and balance sheet health.
- Combine fundamental earnings analysis with technical analysis (support/resistance, volume, moving averages) for better decisions.
- Practice by following 5–10 companies through an entire earnings season and tracking their price reactions in your trading journal.
Understanding how to read earnings reports is a vital skill that bridges fundamental and technical analysis. It complements the key financial metrics guide from the previous post and will help you make more informed decisions whether you’re swing trading or investing long-term.
In upcoming posts, we’ll cover economic indicators that move markets, sector rotation strategies, and how to build a complete trading plan that incorporates both technical and fundamental analysis.