Economic indicators are the heartbeat of the financial markets. They reveal the health of the economy and heavily influence central bank decisions, investor sentiment, and price movements across stocks, forex, bonds, and commodities.
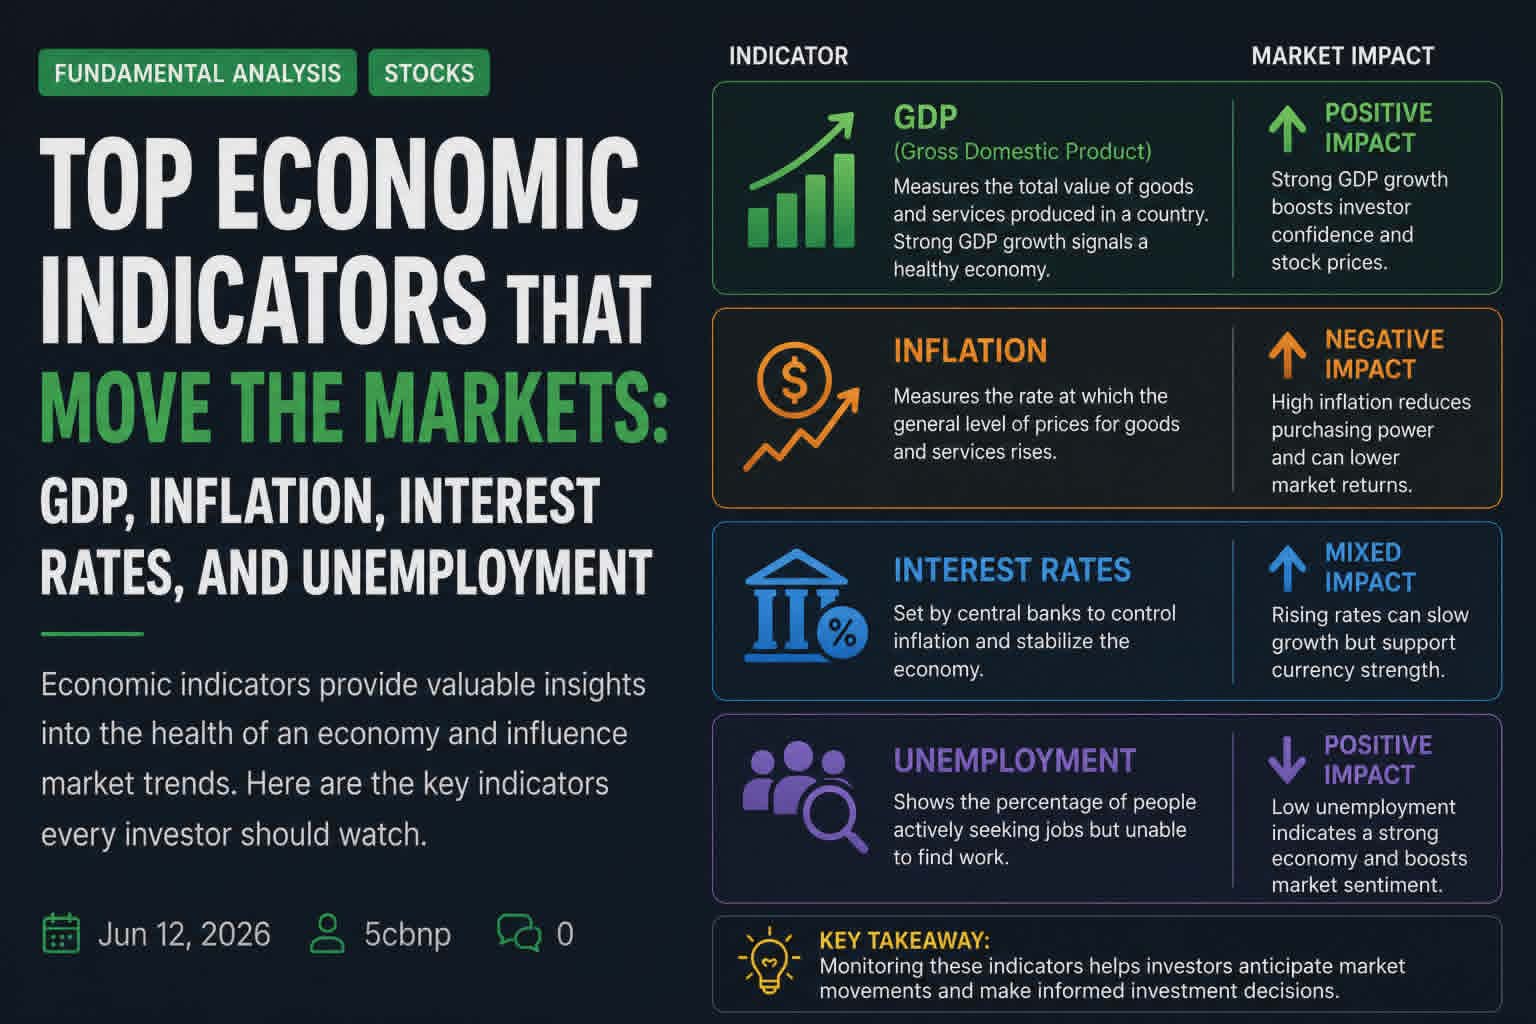
Understanding the top economic indicators is essential for both fundamental traders and technical traders who want to avoid trading against major macro trends. In this guide, we’ll break down the most important ones — GDP, Inflation, Interest Rates, and Unemployment — and explain how they impact the markets.
Important Disclaimer: Trading and investing involve substantial risk of loss and is not suitable for everyone. This article is for educational purposes only and does not constitute financial advice.
My Personal Perspective: Why Serious Traders Follow Macro Events Closely
From my years of watching the markets, learning about economic indicators is non-negotiable if you want to understand where massive volatility comes from. These major macroeconomic events are what professional, institutional-grade traders follow closest because they dictate the overarching direction of entire global markets.
When high-impact data drops, price action can turn into an absolute frenzy within seconds. Knowing how to read these releases ensures you are never caught on the wrong side of a sudden market-wide shift.
What Are Economic Indicators?
Economic indicators are statistical data points released by governments and organizations that reflect economic performance. They are classified as:
- Leading indicators (predict future trends)
- Lagging indicators (confirm past trends)
- Coincident indicators (show the current state)
High-impact releases often cause immediate volatility, especially Non-Farm Payrolls (NFP), CPI, and Federal Reserve FOMC decisions.
1. Gross Domestic Product (GDP)
What it is: The total monetary value of all finished goods and services produced within a country during a specific period. Released quarterly.
Why it matters: GDP serves as the broadest overall measure of national economic health.
Market Impact:
- Strong GDP growth → Bullish for stocks (especially cyclical sectors), stronger domestic currency
- Weak or contracting GDP → Risk-off sentiment, selling pressure on equities, potential rate cuts
What to watch: Annualized growth rates, revisions to previous quarters, and core consumer spending components.
2. Inflation (CPI & PCE)
What it is:
- CPI (Consumer Price Index) measures changes in the price of a standard basket of consumer goods and services.
- Core CPI strips out volatile food and energy prices to show underlying trends.
- PCE acts as the Federal Reserve’s preferred inflation gauge.
Why it matters: Persistent inflation erodes purchasing power and dictates central bank monetary policy.
Market Impact:
- Higher-than-expected inflation → Bond yields surge, growth stocks often fall sharply, currency strengthens
- Cooling inflation → Bullish for stocks and bonds, raises expectations for rate cuts
3. Interest Rates & Central Bank Decisions (FOMC, ECB, etc.)
What it is: Central banks set benchmark interest rates to control inflation levels and support employment figures.
Key Events: FOMC meetings, rate decisions, and accompanying press conferences.
Market Impact:
- Rate hikes → Stronger currency, heavy pressure on tech stocks, higher bond yields
- Rate cuts or a dovish tone → Weaker currency, highly bullish for stocks and gold
- Forward guidance is frequently more important than the actual headline rate change itself
4. Unemployment & Non-Farm Payrolls (NFP)
What it is:
- Unemployment Rate: The percentage of the active labor force that is currently jobless
- Non-Farm Payrolls (NFP): The monthly net change in U.S. jobs (excluding agricultural workers)
Why it matters: Employment metrics drive consumer spending power and overall economic growth.

Market Impact:
- Strong NFP + falling unemployment → Resilient economy, potential for higher rates (can trigger mixed stock reactions)
- Weak NFP → Risk-off sentiment initially, but raises rate-cut expectations (often bullish longer-term)
Summary Table: How Major Indicators Affect Markets
| Indicator | Stronger/Better Reading | Weaker Reading | Most Affected Markets |
|---|---|---|---|
| GDP | Bullish stocks, stronger currency | Bearish stocks, weaker currency | Stocks, Forex |
| Inflation (CPI) | Higher rates, bearish stocks | Rate cut expectations, bullish stocks | Bonds, Stocks, Gold, Forex |
| Interest Rates | Stronger currency, pressure on stocks | Bullish for stocks & risk assets | All markets |
| Unemployment/NFP | Potential rate hikes | Rate cut expectations | Stocks, Forex, Bonds |
Real-World Examples
Example 1: Hot Inflation (2022–2023) When CPI prints came in hotter than expected multiple times, the Fed aggressively hiked rates. This drove a brutal bear market across growth equities and strengthened the U.S. Dollar significantly.
Example 2: Strong NFP Surprise A much stronger-than-expected NFP report can cause initial selling in stocks due to fear of higher rates, while pushing the dollar sharply higher against forex peers.
Example 3: Cooling Inflation & Rate Cuts As inflation moderates, markets frequently rally in anticipation of central bank rate pivots, with growth assets and small caps leading the expansion.
How to Trade Economic Indicators
- Calendar Awareness — Use economic calendars (such as Investing.com or Forex Factory) to track exact release schedules.
- Avoid Trading Blindly — Many disciplined traders reduce position sizing or stay out entirely during high-impact releases.
- Trade the Reaction, Not Just the Number — Focus on how data compares to consensus estimates and how policy makers respond.
- Use Technical Levels — Combine macro data releases with support, resistance, and volume profile analysis.
- Adopt a Longer-Term View — Macroeconomic releases are most useful for swing and position trading frameworks rather than erratic day trading.
Common Mistakes Beginners Make
- Overreacting impulsively to a single isolated data release
- Trading the raw headline number instead of evaluating the “surprise factor” against consensus
- Ignoring pre-existing market expectations
- Failing to consider the broader macroeconomic picture
- Trading high-volatility news events without rigorous risk management
Pro Tip: Pay close attention to central bank “dot plots” and official speeches for forward guidance—this commentary frequently outweighs the headline number itself.
Key Takeaways
- Economic indicators drive major market moves by shifting central bank policy and framing investor sentiment.
- GDP tracks growth, inflation guides policy, interest rates dictate asset valuations, and employment measures consumer strength.
- Always compare actual reports to market expectations—the surprise is what moves prices.
- Blend fundamental macro awareness with technical execution tools for superior results.
- Maintain strict discipline and robust risk protocols around high-impact news events.
- Log major economic releases in your trading journal to refine your pattern recognition over time.
Mastering these top economic indicators will significantly upgrade your understanding of why markets move and help you make more informed trading choices. This knowledge pairs seamlessly with the fundamental metrics and earnings report analysis covered in previous guides.
In upcoming articles, we’ll dive into sector rotation strategies, building a complete trading plan, and mastering trading psychology!