As of mid-June 2026, the U.S. stock market is in a consolidation phase following a strong rally earlier in the year. The S&P 500 and Nasdaq have pulled back from recent highs amid profit-taking, mixed economic signals, and geopolitical developments.
In this post, we’ll provide a clear technical outlook with key support and resistance levels to watch, along with the broader market context.
Important Disclaimer: This is for educational purposes only and is not financial advice. Markets can change rapidly. Always use proper risk management.
My Personal Perspective: Navigating Consolidation Without Losing Your Mind
Looking at where the S&P 500 and Nasdaq are sitting right now, this kind of consolidation phase is precisely where impatient traders get chewed up and spit out. When markets go sideways after a massive run, it’s entirely too easy to fall into the trap of overtrading—jumping at every minor wiggle on a 15-minute chart because you have that itch to be in a position.
From my own experience as a swing trader, choppy, consolidating markets require you to step back, zoom out to the Daily and 4-hour charts, and wait patiently for prices to actually test major structural levels like the ones outlined below. Trying to force trades in the middle of a tight range is a fast track to getting chopped up by false breakouts. Let the market come to your levels, rely on your trading plan, and remember that sitting on your hands in cash is a legitimate, profitable position.
Current Market Snapshot (as of June 12, 2026)
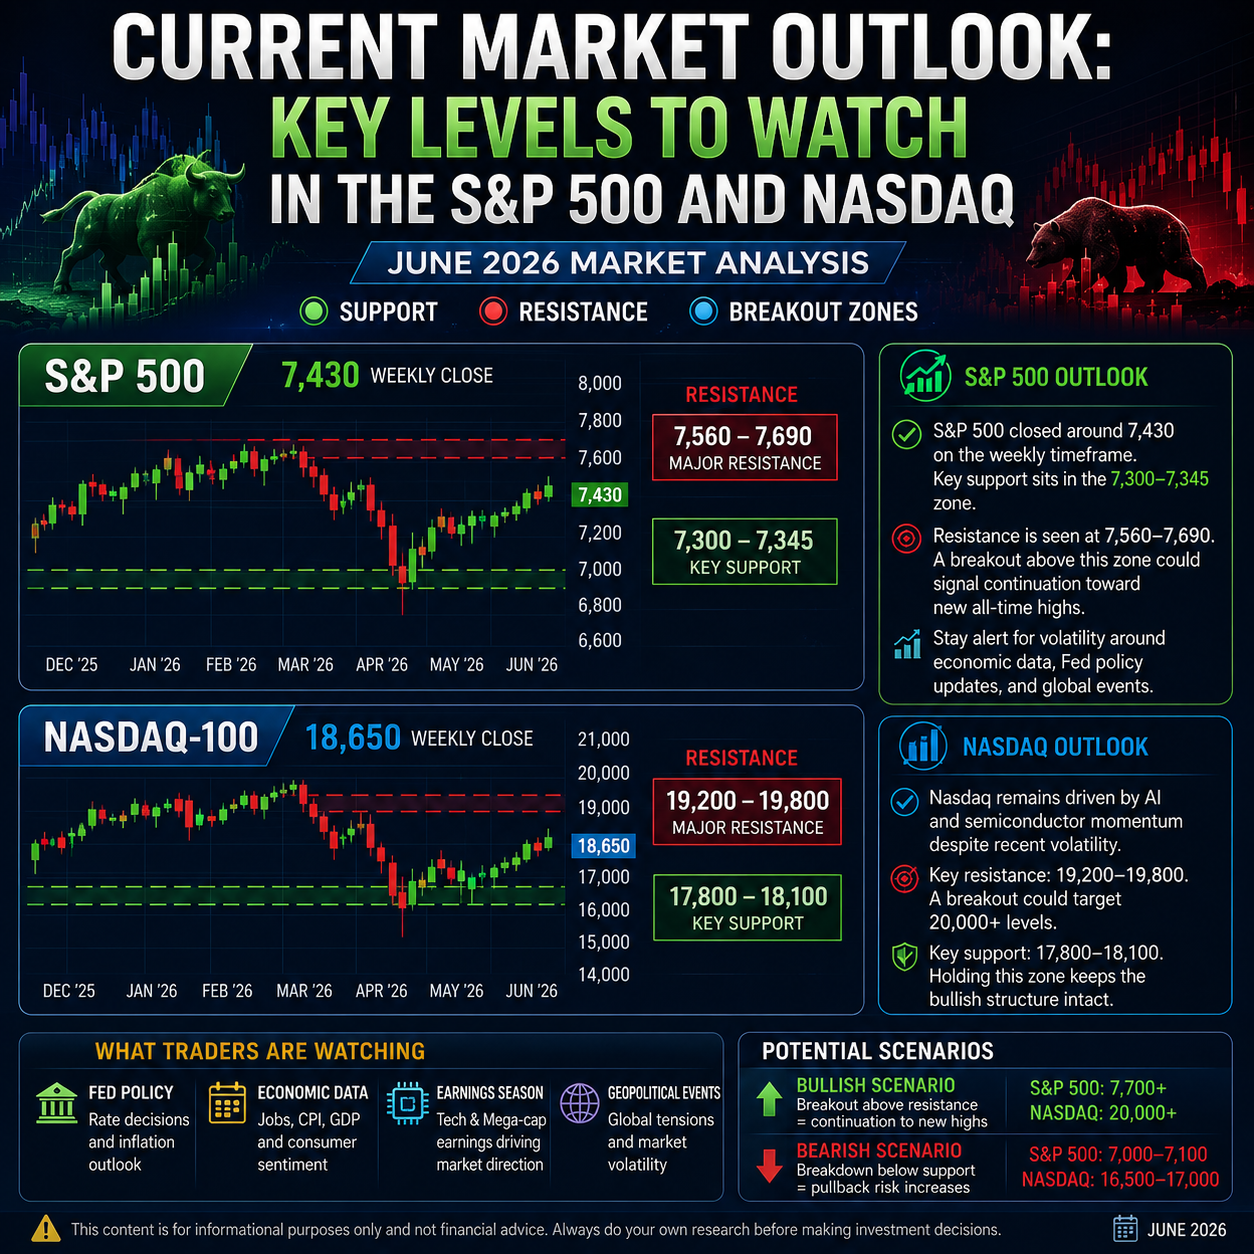
- S&P 500: Trading around 7,390 – 7,420 range after a recent pullback from highs near 7,620.
- Nasdaq Composite: Hovering near 25,800 – 25,900, showing resilience in tech but with signs of short-term cooling.
The market remains in a longer-term uptrend but is experiencing a healthy digestion period after strong gains driven by earnings and AI-related optimism.
Key Technical Levels for S&P 500
Major Resistance Levels:
- 7,466 – Recent swing high
- 7,500 – Psychological round number and strong resistance zone
- 7,620 – All-time high area (major overhead supply)
Key Support Levels:
- 7,385 – Near-term trend support / 50-day moving average area
- 7,334 – Important short-term support
- 7,200 – Major support and potential higher-low zone
- 7,000 – Major psychological and long-term support
Bias: Neutral to mildly bullish. A decisive break and hold above 7,500 would signal renewed strength toward new highs. A break below 7,334 could open the door to a deeper pullback toward 7,200.
Key Technical Levels for Nasdaq
Major Resistance Levels:
- 26,000 – Psychological level
- 26,500 – Recent highs
- 27,000+ – Extension toward all-time highs
Key Support Levels:
- 25,500 – Near-term support
- 24,800 – 38.2% Fibonacci retracement zone (important)
- 23,000 – Deeper correction level (50%+ retracement)
Bias: Nasdaq has been more volatile than the S&P 500 due to its heavy tech weighting. It is showing relative strength in big-cap tech but remains sensitive to interest rate expectations.
Broader Market Context & What to Watch
- Earnings Strength: Q2 2026 earnings have been robust, particularly in technology and AI-related sectors, supporting the longer-term bullish case.
- Economic Indicators: Focus on upcoming inflation data, Fed commentary, and employment figures. Cooling inflation could support rate cut expectations and boost risk assets.
- Geopolitical Factors: Developments in the Middle East and trade relations continue to influence sentiment and commodity prices.
- Market Breadth: Watch whether small- and mid-cap stocks begin to participate more broadly, which would confirm a healthier rally.
Trading Strategies for Current Conditions
- Bullish Scenario — Look for pullback buys near key support levels (e.g., 7,334 or 7,200 on S&P) with confirmation from candlesticks, RSI, or volume.
- Bearish / Cautious Scenario — A break below recent supports could target 7,000–7,200 zone. Use tighter stops and reduce position sizes.
- Range-Bound Approach — Trade bounces between support and resistance with clear risk-reward ratios (minimum 1:2).
Pro Tip: Use Multiple Timeframe Analysis (Daily for trend, 4H/1H for entries) and always combine with volume and the indicators covered in previous posts (Moving Averages, RSI, MACD, Fibonacci).
Key Takeaways
- The market is in a consolidation phase within a longer-term uptrend.
- S&P 500 key zone to watch: 7,334 – 7,500
- Nasdaq remains tech-driven and more volatile.
- Focus on high-probability setups near major levels rather than chasing price.
- Maintain strict risk management (1% per trade) and follow your trading plan.
- Stay updated with economic calendars and earnings reports.
This market environment rewards patience and discipline above all else. We’ll continue to update key levels in future posts as the situation evolves!