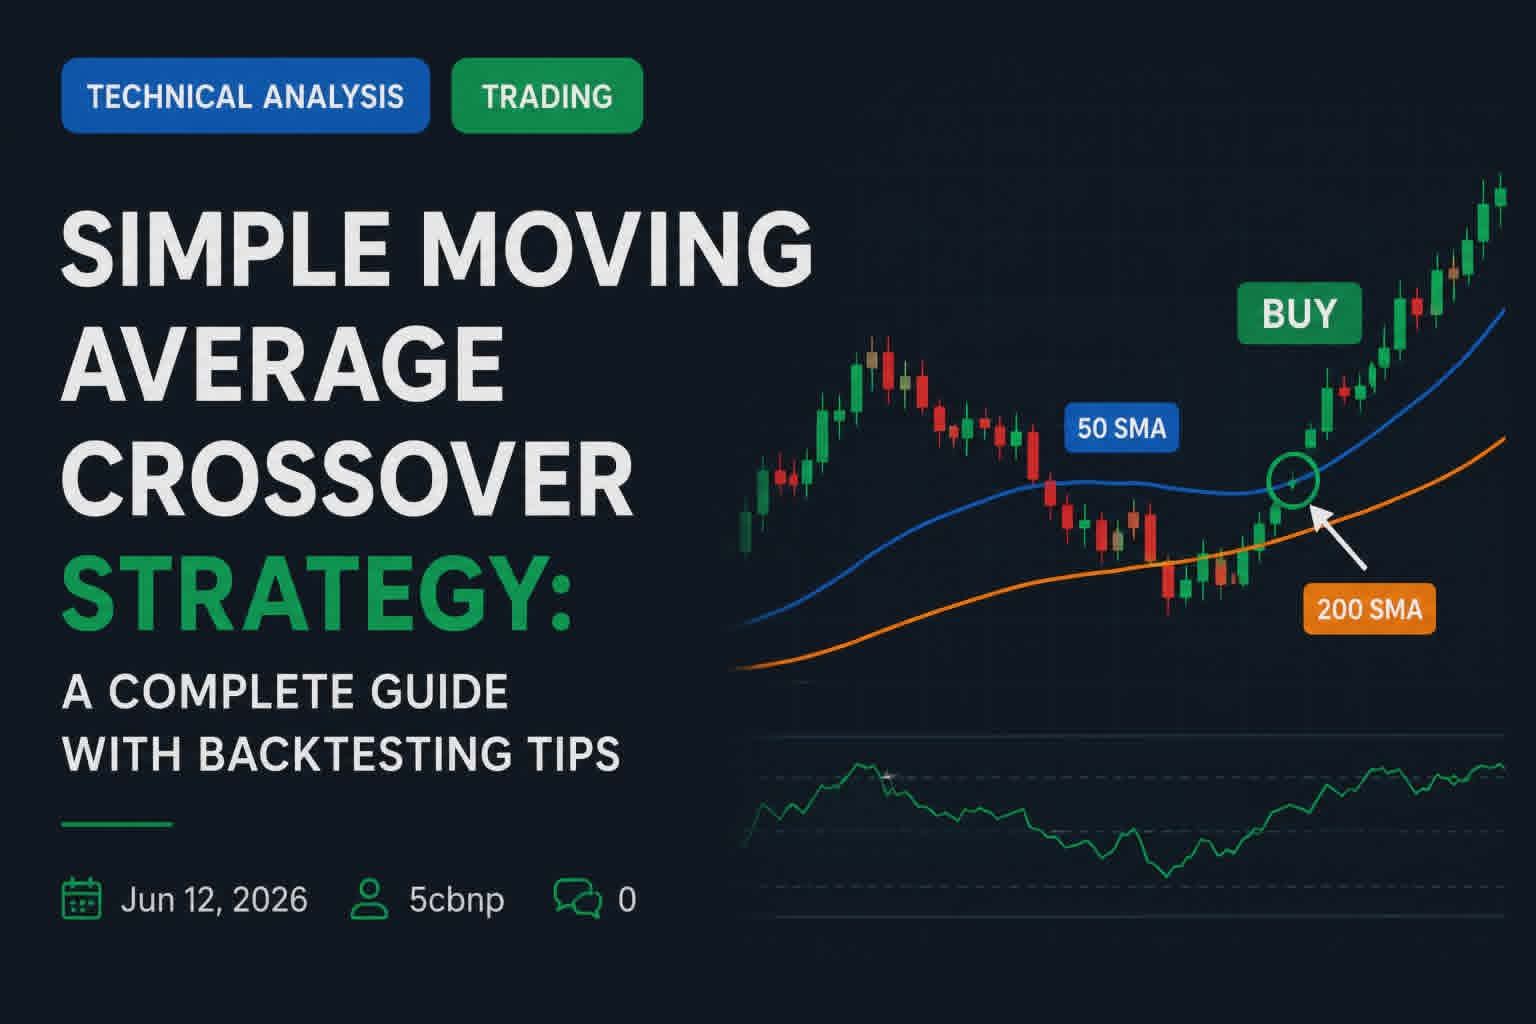
The Simple Moving Average (SMA) Crossover Strategy is one of the most popular and beginner-friendly trading strategies in technical analysis. It is easy to understand, rule-based, and works across stocks, forex, crypto, and futures.
This strategy uses two moving averages of different lengths to generate clear buy and sell signals. In this comprehensive guide, you’ll learn exactly how the strategy works, optimal settings, how to backtest it properly, and how to improve its performance with risk management.
Important Disclaimer: Trading involves substantial risk of loss and is not suitable for everyone. This article is for educational purposes only and does not constitute financial advice. Always backtest thoroughly and use proper risk management.
My Personal Perspective: Why SMA Crossovers Are a Staple in Algorithmic Trading
From my own hands-on experience, I have tried this strategy extensively, and I have to say it is really interesting to watch in action. There is something profoundly satisfying about building a rule-based crossover system and watching it capture clean, sweeping market trends.
Beyond manual charting, this exact logic is widely utilized in algorithmic trading and automated quantitative systems. Because code can execute orders instantly without emotional hesitation, institutional quants and retail automation builders rely heavily on moving average crossovers. When a fast line slices through a slow line—especially on higher timeframes—it frequently indicates that a major institutional move is underway, triggering cascade momentum that smart traders capitalize on.
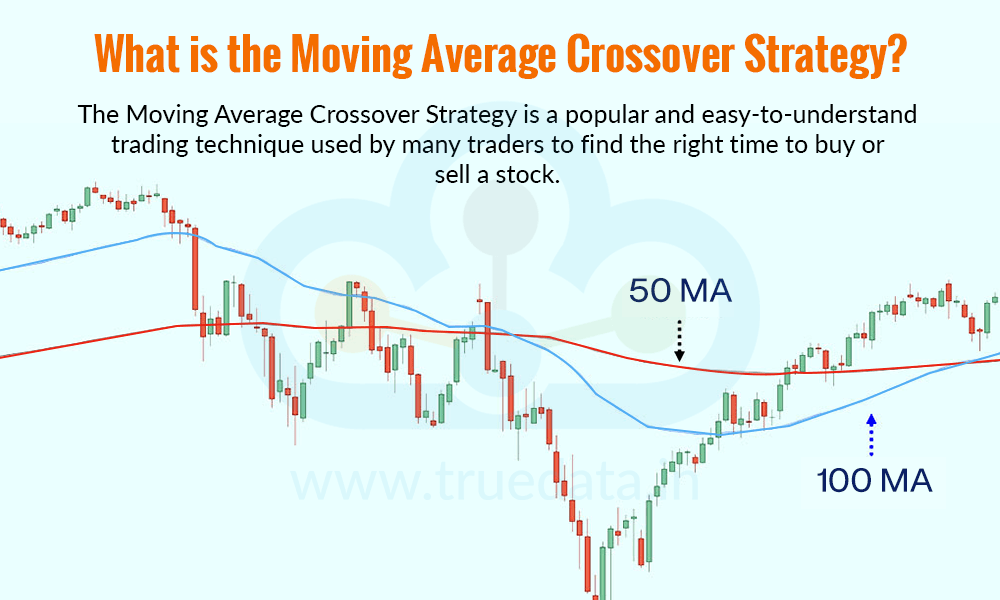
How the SMA Crossover Strategy Works
The strategy relies on two Simple Moving Averages:
- Fast SMA (shorter period) — more responsive to recent price action
- Slow SMA (longer period) — smoother and shows the longer-term trend
Trading Signals:
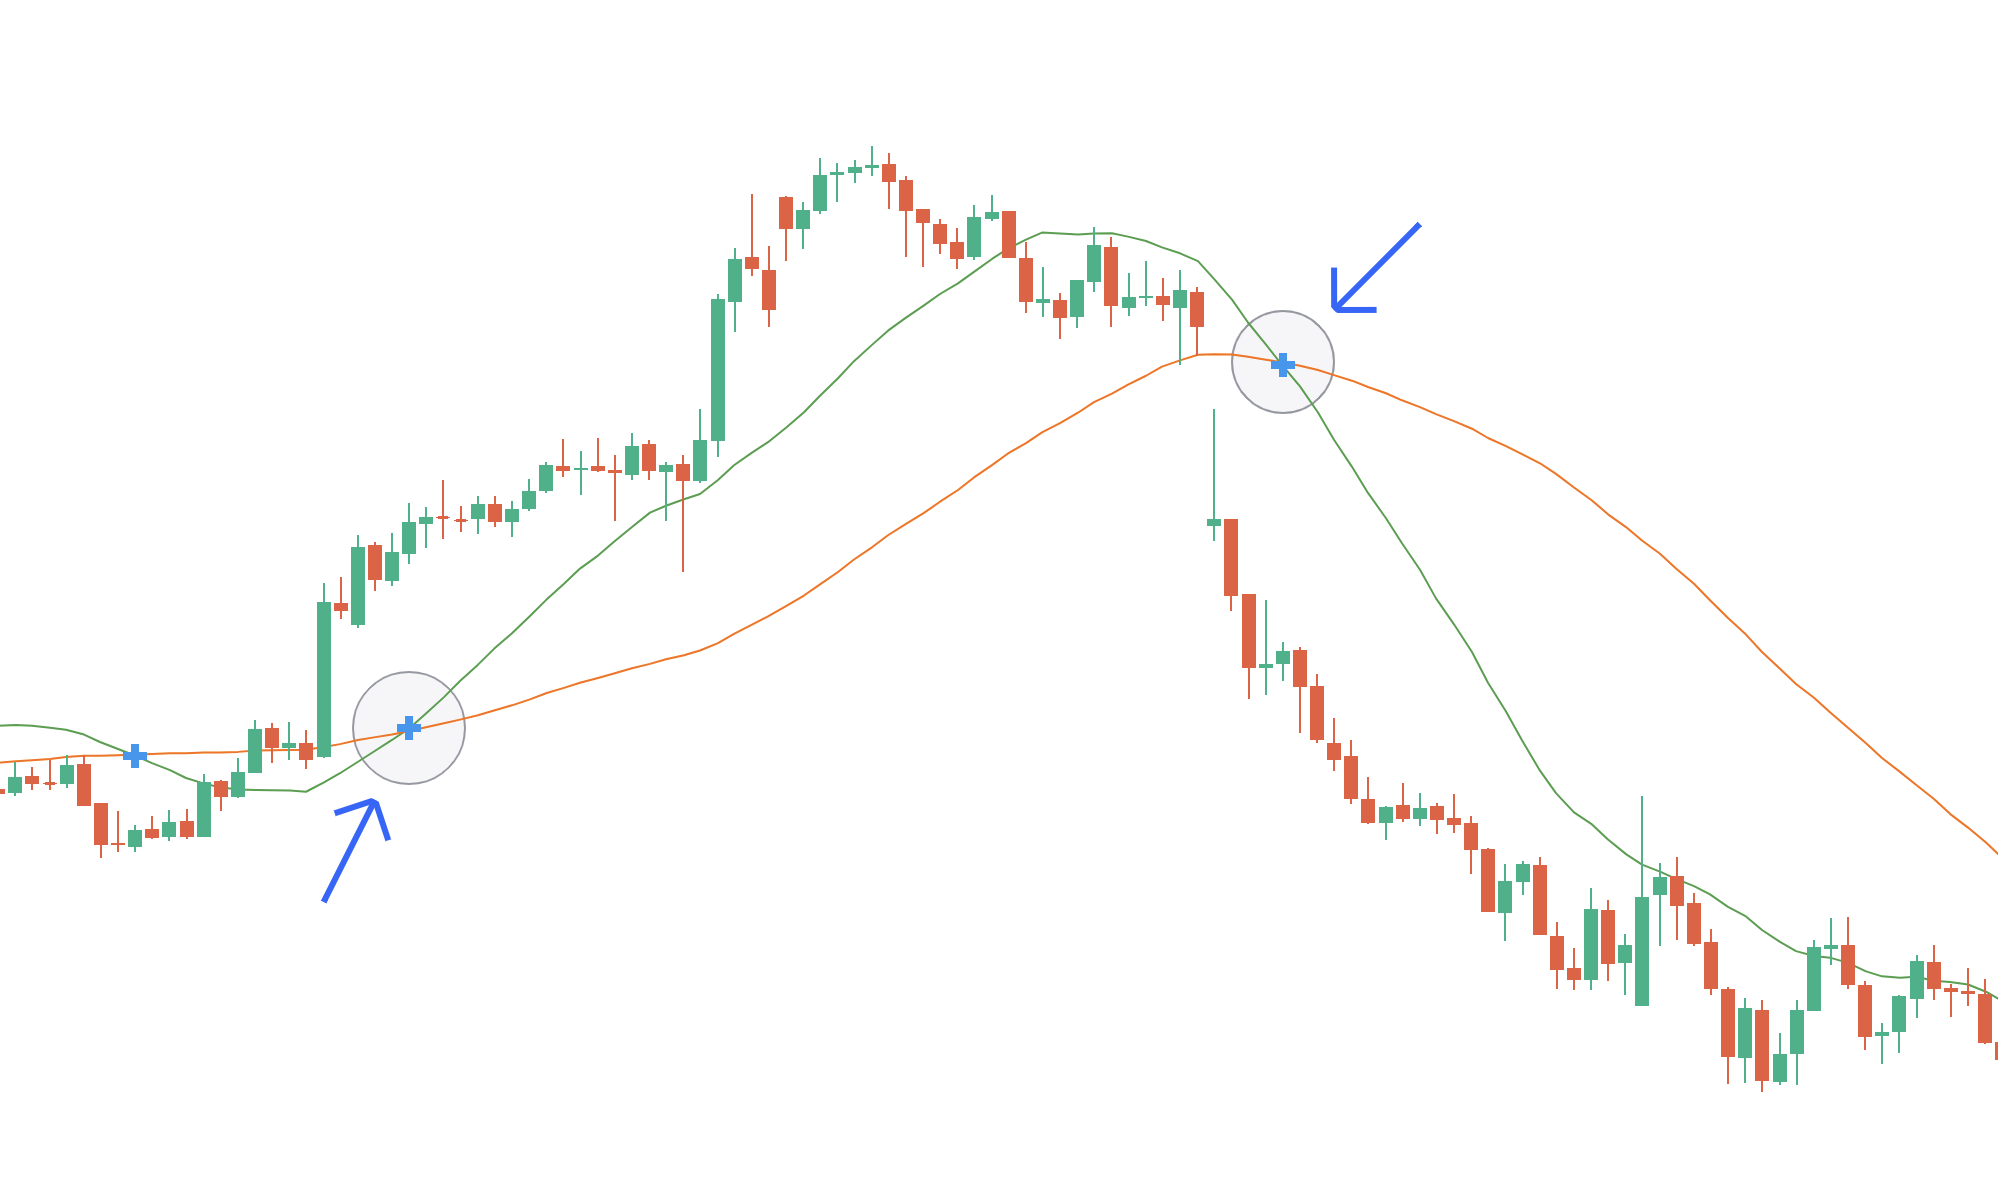
- Buy (Golden Cross): The fast SMA crosses above the slow SMA
- Sell / Exit (Death Cross): The fast SMA crosses below the slow SMA
This crossover indicates a potential shift in momentum and trend direction.
Popular SMA Settings
| Trading Style | Fast SMA | Slow SMA | Best Timeframe |
|---|---|---|---|
| Day Trading | 9 or 10 | 21 | 5-min / 15-min |
| Swing Trading | 20 or 50 | 100 or 200 | 4H / Daily |
| Long-term | 50 | 200 | Daily / Weekly |
The classic 50/200 SMA combination is widely watched by institutions and often produces powerful signals.
Step-by-Step Trading Rules
- Identify the Trend (Higher Timeframe Filter)
- Only take long trades when price is above the 200 SMA on the Daily chart.
- Only take short trades when price is below the 200 SMA.
- Wait for Crossover
- Enter long when fast SMA crosses above slow SMA.
- Enter short (or exit long) when fast SMA crosses below slow SMA.
- Add Confluence (Recommended)
- Support/Resistance levels
- Candlestick confirmation
- RSI (not oversold for longs, not overbought for shorts)
- Volume increase on crossover
- Risk Management
- Stop-loss: Below recent swing low (for longs) or above swing high (for shorts)
- Target: Minimum 1:2 risk-reward ratio
- Position size: Risk max 1% of account per trade
Backtesting Tips (Essential for Success)
Backtesting helps you understand how the strategy performs before risking real money.
How to Backtest Properly:
- Choose a Platform — TradingView (easy), Python (more advanced), or Excel.
- Select Assets & Time Period — Test on multiple assets (e.g., SPY, EUR/USD, BTC) over at least 3–5 years of data.
- Define Clear Rules — Write down exact entry, exit, stop-loss, and filters. No discretionary decisions.
- Record Key Metrics:
- Win rate
- Average win vs average loss
- Maximum drawdown
- Profit factor (total profits / total losses)
- Number of trades
- Walk-Forward Analysis — Test on historical data, then validate on out-of-sample (newer) data.
- Account for Slippage & Commissions — Real trading costs reduce performance.
Pro Tip: A strategy with a 45–55% win rate can still be highly profitable if the average win is much larger than the average loss (good risk-reward).
Real-World Examples
Example 1: S&P 500 (SPY) – 50/200 SMA In late 2023, the 50-day SMA crossed above the 200-day SMA (Golden Cross) while price was above the 200 SMA. This signaled the start of a strong bull market that continued through recent years, delivering excellent returns for swing traders.
Example 2: Bitcoin On the daily chart, BTC frequently produces reliable 20/50 SMA crossovers during trending markets. A bullish crossover near a major support level often leads to a significant expansion rally.
Example 3: EUR/USD A death cross on the 4H chart during a downtrend provided a high-probability short setup with a clean 1:3 risk-reward outcome.
Pros and Cons of the SMA Crossover Strategy
Pros:
- Simple and easy to follow with clear rules
- Works exceptionally well in strongly trending markets
- Can be fully automated via algorithms
- Great foundational approach for beginners
- Effective across multiple timeframes and asset classes
Cons:
- Lags behind fast-moving price action or choppy ranging markets
- Prone to whipsaws and false signals during sideways conditions
- Requires strong trend-filtering to remain profitable
- Not ideal as an isolated standalone strategy without confluence
How to Improve the Strategy
- Add a higher timeframe trend filter (as mentioned earlier)
- Combine with RSI or MACD for momentum confirmation
- Use volume analysis to validate whether a crossover has institutional backing
- Incorporate key support and resistance or Fibonacci retracement levels
- Trade primarily during high-liquidity market sessions
- Maintain a detailed trading journal for every single backtested and live trade
Key Takeaways
- The Simple Moving Average Crossover Strategy is an excellent starting point for new traders due to its simplicity and visual clarity.
- Use a fast and slow SMA combination that directly matches your trading style and timeframe.
- Always apply a higher timeframe trend filter and strict risk management protocols.
- Backtest thoroughly across multiple assets and market cycles before deploying live capital.
- The strategy performs best in trending environments — avoid choppy, sideways price action.
- Combine it with other technical tools (Support & Resistance, Candlesticks, RSI, MACD, Volume) for superior results.
- Focus on execution discipline and process consistency rather than chasing every minor crossover.
This strategy builds directly on the Moving Averages post earlier in the series and serves as a practical application of many core concepts covered so far.
In future posts, we’ll explore more advanced trading systems, including how to combine technical indicators with fundamental market analysis!