In the world of trading, there is a dangerous temptation to jump into the market with a “gut feeling.” You see a shiny new indicator, or you hear about a strategy that worked for someone on a forum, and you immediately deploy it with real capital. This is not trading; this is gambling.
The bridge between gambling and professional trading is backtesting.
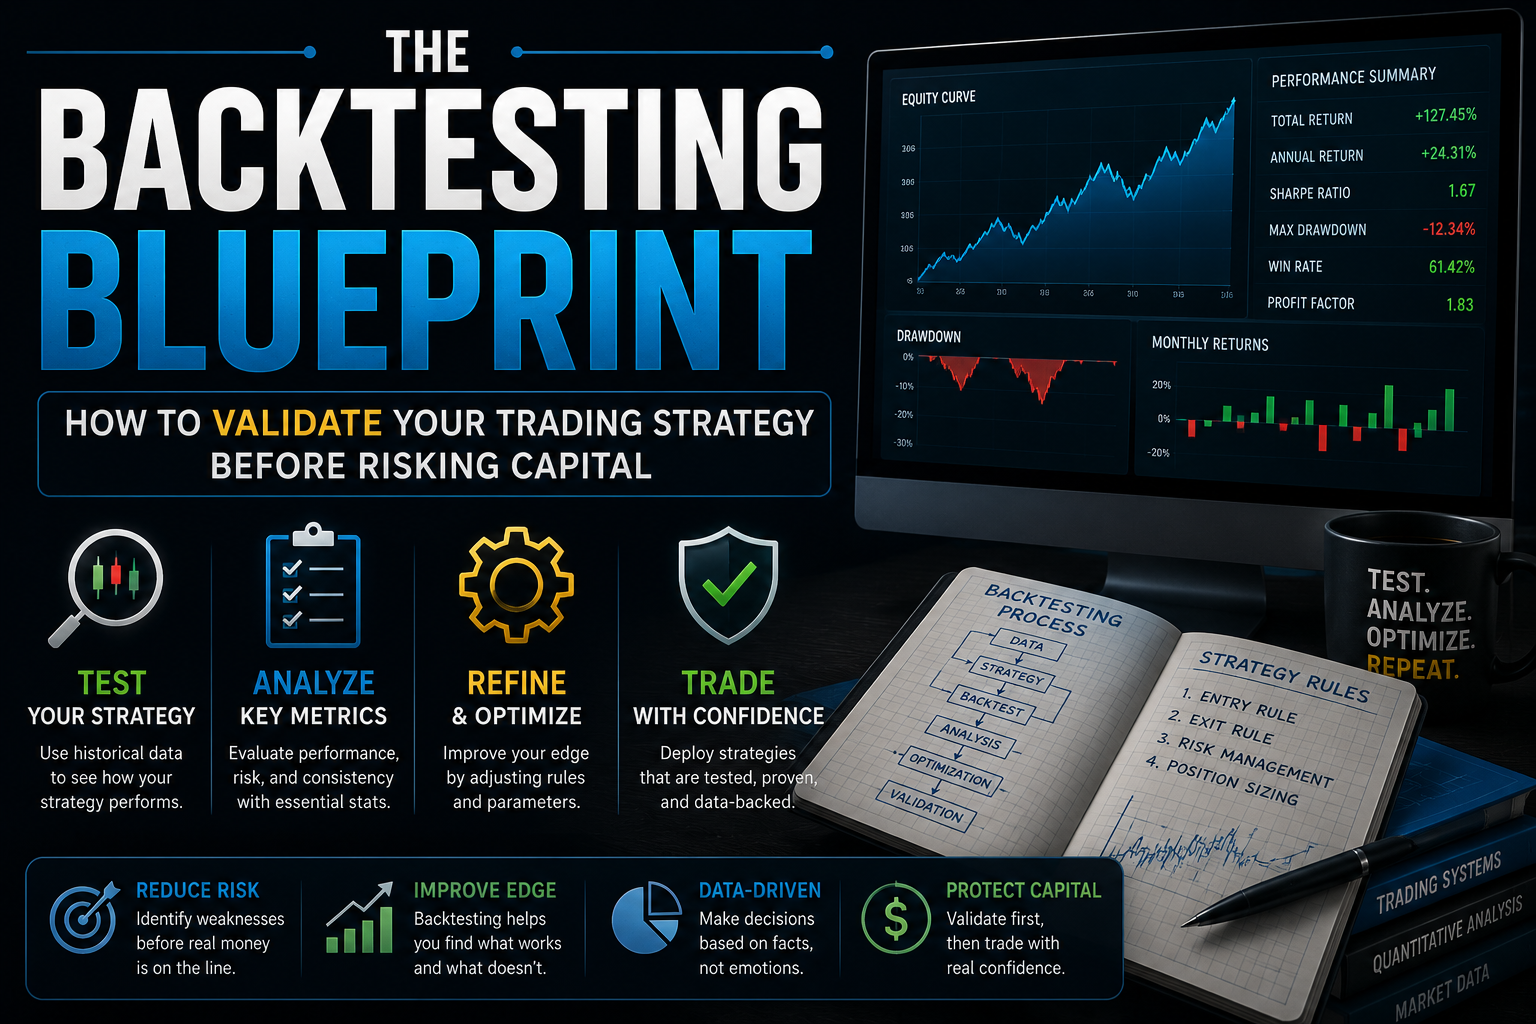
Backtesting is the process of applying a trading strategy to historical market data to see how it would have performed in the past. It is the only way to transform a subjective theory into an objective, data-driven system. If you want to build a career as a trader, you must stop guessing and start calculating.
This guide will walk you through the essential tools, the rigorous best practices, and the common pitfalls that every serious trader must avoid.
Why Backtesting is Non-Negotiable
Every trading strategy has a “positive expectancy” or it doesn’t. A strategy with positive expectancy is one that, over a large number of trades, makes more money on winning trades than it loses on losing trades.
Without backtesting, you have no idea what your expectancy is. You are flying blind. When you backtest, you achieve three things:
- Confidence: When you enter a period of “drawdown” (losing streaks), you will be tempted to quit. If you have backtested your strategy, you know that drawdowns are mathematically normal, which helps you stay disciplined.
- Optimization: You can identify which market conditions (trending vs. ranging) your strategy prefers.
- Risk Management: You can calculate your “Maximum Drawdown”—the worst peak-to-trough decline—allowing you to size your positions appropriately so you never blow up your account.

My Personal Perspective: Confirmation, Probability, and Learning from the Best
If there is one thing I’ve learned through every cycle, it’s that successful trading isn’t about finding a magical crystal ball—it’s entirely about stacking odds in your favor through confirmation and probability. I am obsessed with finding confluence. When multiple technical indicators, macro fundamentals, and historical patterns align, that intersection gives me the high-probability edge needed to pull the trigger.
That mindset is why I closely follow veteran market minds like Gareth Soloway. Watching how someone with his level of experience breaks down macro charts, identifies key technical levels, and constantly talks in terms of probabilities has completely shaped how I view the markets. Soloway always emphasizes that trading is a game of probabilities, not certainties—you manage your risk, wait for the charts to confirm your thesis, and let the math work out over a series of trades. Backtesting is simply the tool that proves those probabilities actually exist before you risk hard-earned capital.
Tools for the Modern Trader
You do not need a degree in data science to backtest, though the tools you choose will depend on your technical comfort level.
1. TradingView (Pine Script)
For the majority of retail traders, TradingView is the gold standard. Using its proprietary language, Pine Script, you can code a strategy, define your entry and exit rules, and hit a button to see a full performance report.
- Pros: Highly visual, massive community support, and easy to use for beginners.
- Best for: Trend-following strategies and price-action systems.
2. MetaTrader 4/5 (Strategy Tester)
MetaTrader is the classic platform for Forex and CFD traders. The “Strategy Tester” allows you to load historical data (sometimes from third-party sources to ensure accuracy) and run an “Expert Advisor” (EA).
- Pros: Industry standard for automation.
- Best for: Forex traders who want to run automated bots 24/7.
3. Python (Backtrader / VectorBT / Pandas)
If you are comfortable with a little coding, Python is the most powerful tool available. It allows for “vectorized” backtesting, which can run millions of permutations of a strategy in seconds—something traditional charting software simply cannot do.
- Pros: Ultimate flexibility. You can scrape custom data, integrate AI/Machine Learning models, and test complex multi-asset portfolios.
- Best for: Advanced traders who want to build institutional-grade models.
4. Excel/Google Sheets
Do not underestimate the low-tech approach. If you have a simple mechanical strategy (e.g., “Buy when the price closes above the 200-day EMA”), you can manually export CSV data and track the results in a spreadsheet.
- Pros: Forces you to look at every single trade manually, which builds intuition better than any automated script.
- Best for: Discretionary traders focusing on “screen time” and trade journaling.
The Best Practices of Rigorous Testing
Most traders fail at backtesting because they “over-optimize.” They tweak their variables until the strategy shows a perfect profit curve, only to find that it fails instantly when deployed in live markets. This is called Curve Fitting.
Here is how to test like a professional.
1. Account for Transaction Costs (The Hidden Killer)
Beginners often look at their backtest results and see a 40% profit. They forget that the test assumed they could buy and sell at the exact same price, with zero cost.
- Slippage: In the real world, you rarely get your exact entry price during high volatility. You must build a “slippage” buffer into your test (e.g., assuming a 1–2 tick loss on every entry/exit).
- Commissions: If you are day trading, commissions will eat your profits. Always deduct your broker’s commission fees from every single trade in your model. If the strategy is still profitable after fees, you have a winner.
2. Use Out-of-Sample (OOS) Testing
This is the most critical concept in technical analysis.
- In-Sample Data: This is the data you use to build and “tune” your strategy (e.g., 2020–2024).
- Out-of-Sample Data: Once your strategy looks good, you must test it on a period of data the strategy has never seen before (e.g., 2025).
- If your strategy performed amazingly during the “In-Sample” period but falls apart during the “Out-of-Sample” period, it is curve-fitted and will fail in real life. It is not a strategy; it is just a history lesson.
3. Beware of Survivorship Bias
When backtesting stocks, make sure you use a data source that includes “delisted” stocks. If your database only includes the stocks trading today, you are suffering from survivorship bias. You are testing your strategy on the “winners” and ignoring the companies that went bankrupt. This will artificially inflate your success rate.
4. Look-Ahead Bias
Ensure your code does not “cheat.” A common mistake is using the closing price of a candle to trigger a trade, while the code assumes the trade happened at the opening price of that same candle. This is “look-ahead bias”—you are using future information to make a past decision. Always ensure your entry signals are generated based on the previous completed candle.
A Simple Framework for Your First Backtest
If you have never done this, don’t try to build a complex AI model. Start with a “Mechanical Strategy.”
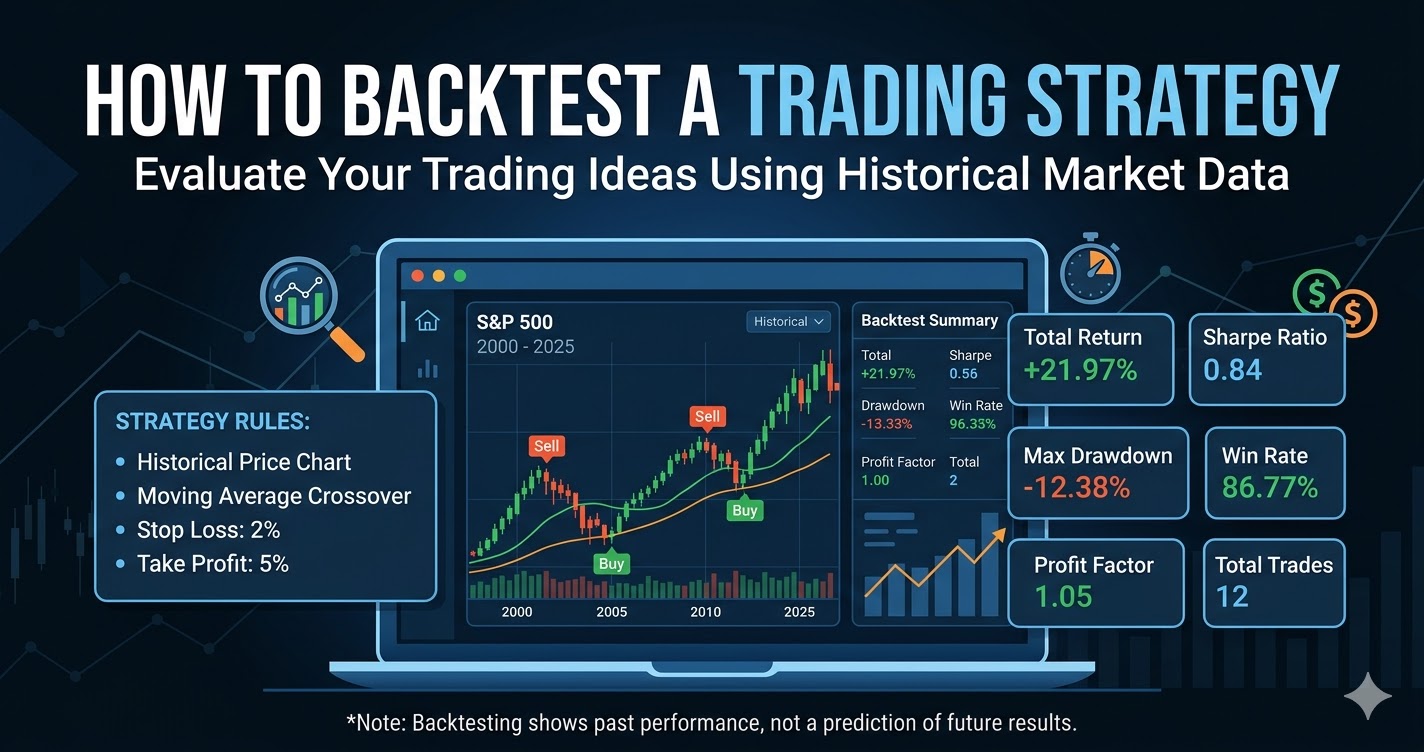
- Define the Logic: “I will buy when the 50 SMA crosses above the 200 SMA (Golden Cross). I will sell when the 50 SMA crosses below the 200 SMA (Death Cross).”
- Define the Universe: Pick one liquid asset (like the S&P 500 ETF, SPY, or Bitcoin).
- Run the Test: Log every trade in a spreadsheet or a script. Record the Entry Date, Exit Date, Profit/Loss, and Drawdown.
-
Analyze the Metrics:
- Win Rate: What percentage of trades were winners?
- Profit Factor: Total Profit divided by Total Loss. (Aim for > 1.5).
- Max Drawdown: What was the biggest “oops” moment in the account? Are you mentally prepared to handle that?
Conclusion: The Goal is Survival
The goal of backtesting is not to find a “get rich quick” formula. It is to find a system that is robust enough to survive the chaotic, unpredictable nature of the live markets.
When you finish a backtest, you should feel a sense of relief, not excitement. You should be able to say, “I know exactly what my worst-case scenario is, and I know that my strategy has a mathematical edge over the long run.”
Do not rush this process. Spend the time to code your ideas, test them on out-of-sample data, and account for the harsh realities of slippage and fees. Your future trading account will thank you.
Disclaimer: Content on traderslook.com is for educational and informational purposes only and should not be construed as professional financial advice.