A Sunday map is not a prediction. I am not trying to say where the week “must” go. I am trying to arrive at Monday with three things written down: where price already told a story, what would cancel that story, and where I am not allowed to invent a trade.
If I skip this, I spend Monday reacting to other people’s levels.
What I open
One market. Not twelve.
I use the instrument I will actually trade this week — for many readers that is an index future, a major FX pair, or one liquid stock. The method is the same. I open the weekly chart first, then the daily. I do not start on a 5-minute chart and work “up.” That is how you talk yourself into noise.
This sits on top of the broader multiple timeframe process already on this site. The weekly pass is just the part I refuse to skip.
The three lines that matter
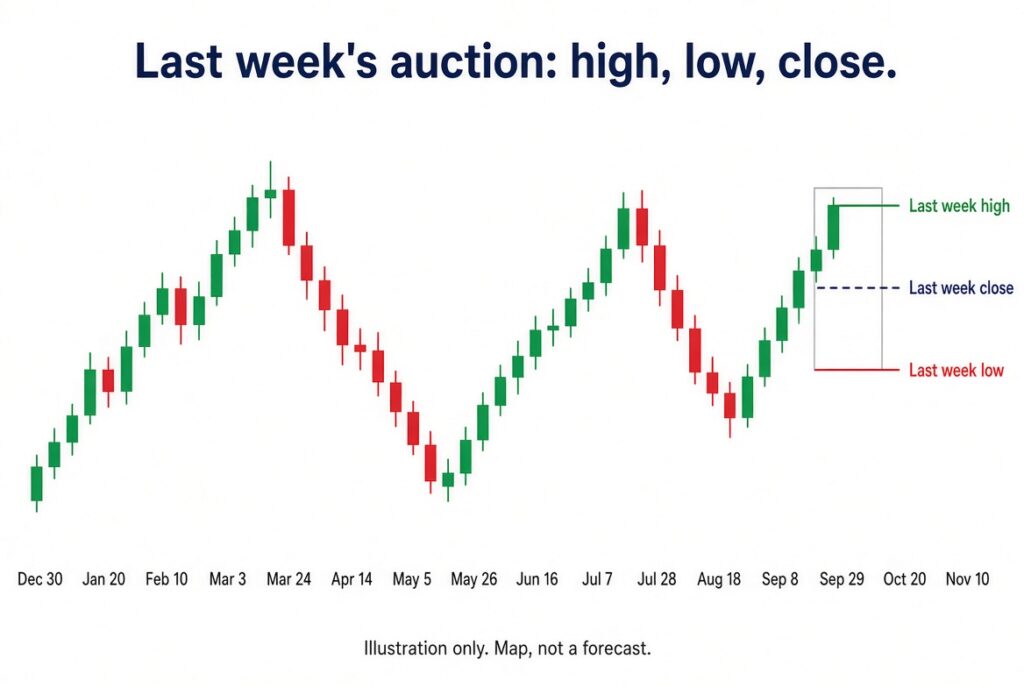
On the weekly candle that just closed I mark:
– Last week’s high
– Last week’s low
– Last week’s close
That is the map of last week’s auction. If the new week opens and immediately spends hours inside that range, I do not treat every tick as a breakout. If price leaves that range and stays outside, I treat the old range as a reference, not as a magnet I must fade.
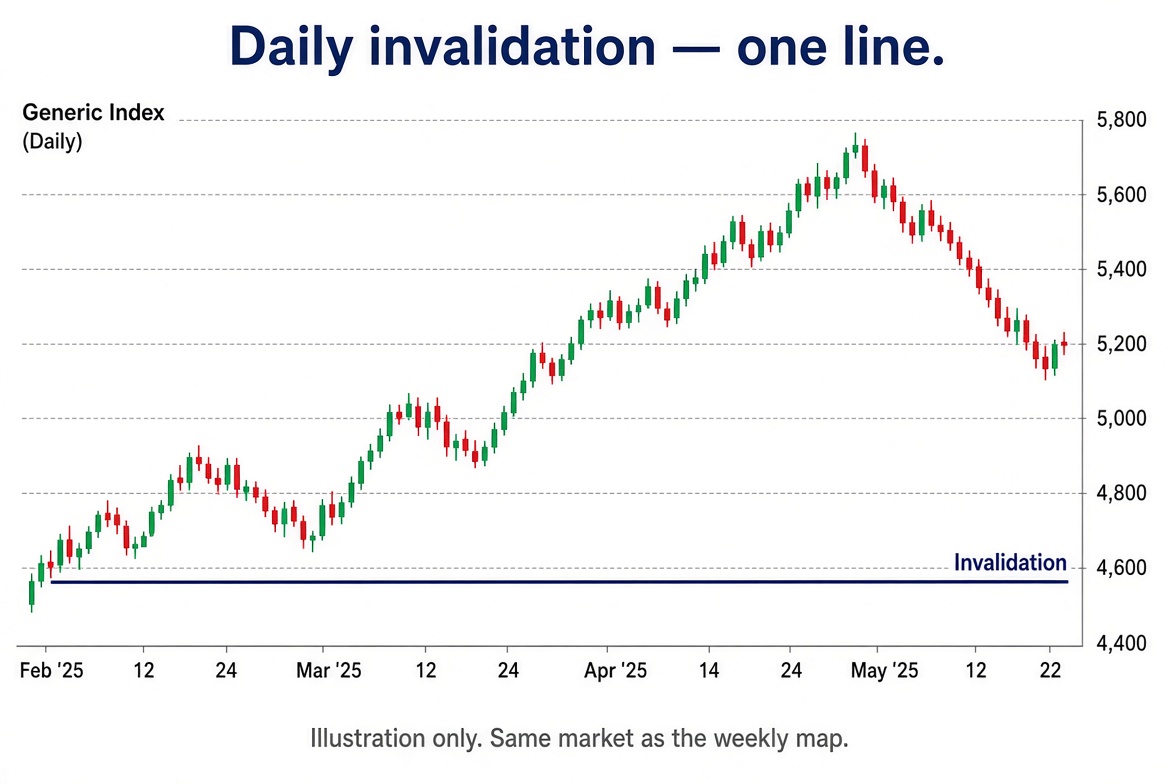
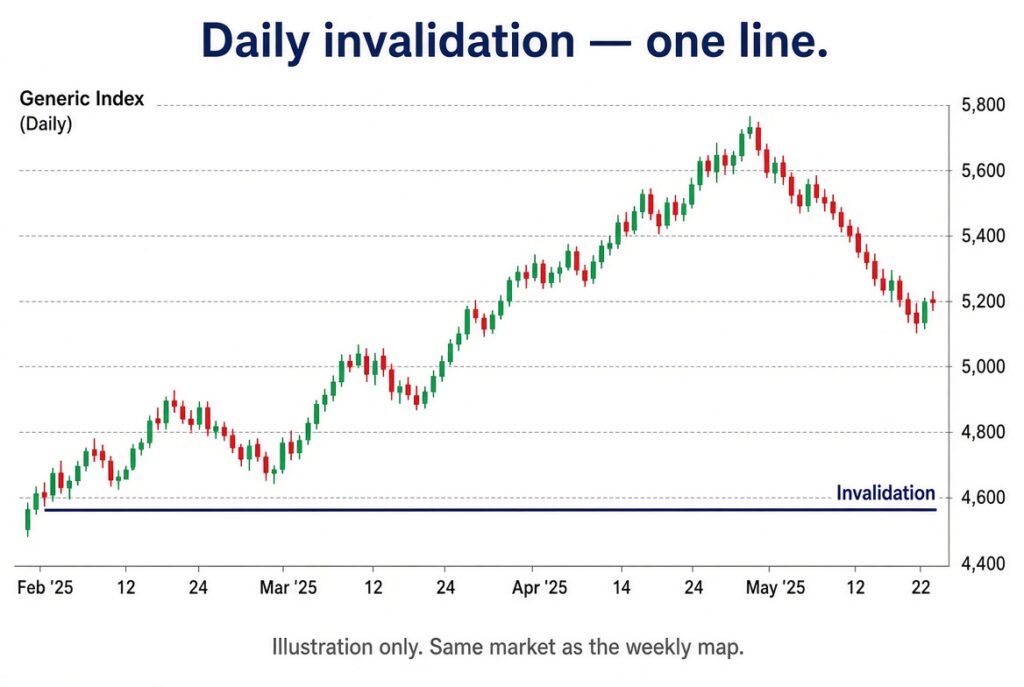
Then on the daily I add one more line: the nearest prior swing that would make last week’s story look wrong if it gave way with a close. One line. If I need six, I do not understand the chart yet.
I wrote more on how I think about those lines in support and resistance. The weekly pass is where I decide which of those levels I am even allowed to care about.
What I write in the notebook
Four lines, on paper or in the journal:
1. Bias in one sentence. Example: “Daily still above last break, weekly did not reverse. I am not hunting shorts first.”
2. Invalidation. The level that ends that sentence.
3. Do-nothing zone. Usually the middle of last week’s range.
4. Event risk. One line if a central bank, CPI, or earnings print sits on the calendar.
That is the whole pre-week file. It should take 15–20 minutes, not an hour of coloring every wick.
What I refuse to do on Sunday
– Draw a price target for Friday and treat it as a plan
– Stack five indicators so the weekly candle “agrees” with me
– Build a watchlist of 30 names because I am bored
– Write entries. Entries belong to the session, after the map exists
If the notebook starts to look like a forecast, I have already failed the exercise.
How this saves me during the week
On Wednesday, when a sharp candle shows up, I only ask: are we still outside last week’s range, and is invalidation intact? If yes, I can stay with the plan. If no, I stop arguing with the chart.
The map does not place the trade. It stops me from trading every impulse as if it were a new thesis.
This is education, not a call on any market. Levels you mark will be different from mine. If you want the risk side of the same habit, read the risk management guide and put size next to the invalidation line before you care about the entry.