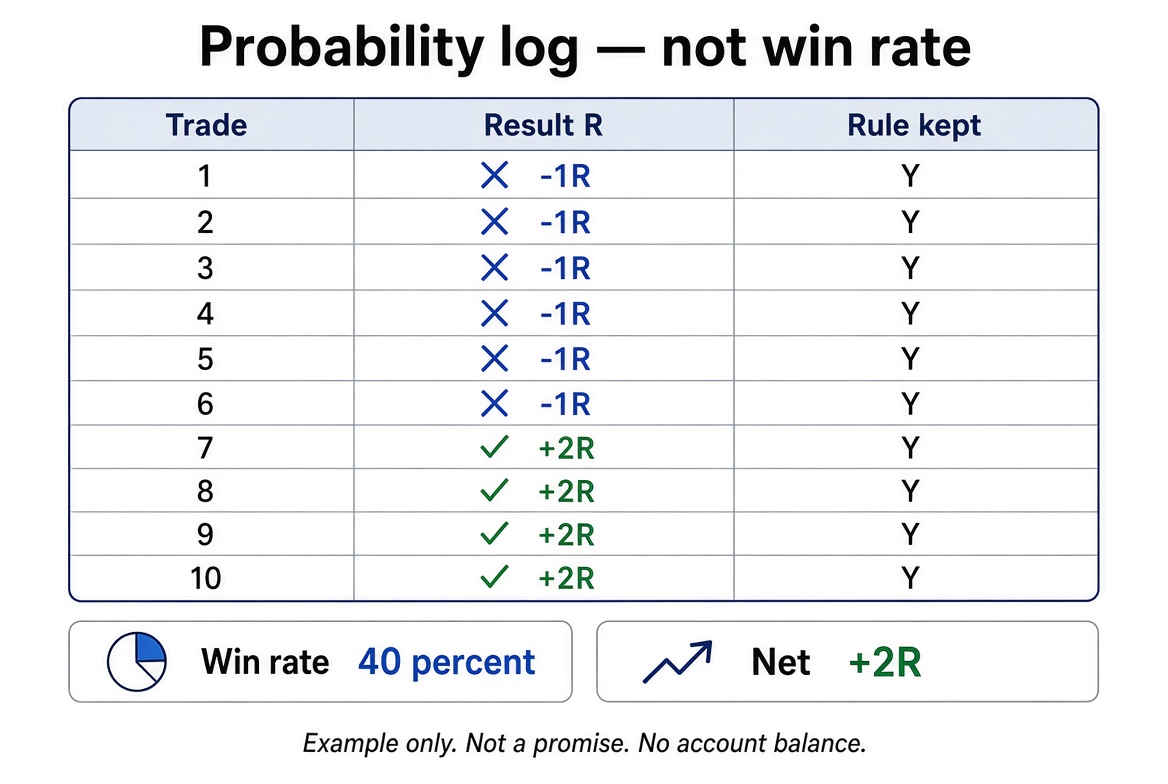
I care about probability. I do not care about a win-rate screenshot.
A 70% win rate that pays 0.3R and loses 2R is a leaking account. A 40% win rate that pays 2R and loses 1R can survive. The second one feels worse in the moment. The first one feels skilled until the month ends.
So the log I actually keep does not lead with wins.
Four fields
- Planned risk in R, written before the fill.
- Result in R, not in account currency.
- Rule kept: yes or no. A winning no is still a no.
- One sentence on why this trade was allowed by the map.
That is enough to see if the 1% unit is doing the job. The longer journal setup is here: how I keep the journal.
What I look at on Friday
Not the percentage of green rows. Three checks:
- Average R on trades where the rule was kept.
- Count of rule-breaks. If it is above zero, those rows do not earn a larger size next week.
- Whether the losers were about 1R. A −3R means the stop was negotiated. That is process, not “variance.”
The monthly review uses the same numbers. I do not invent a second scoreboard for the week.
A worked sketch, not a promise
Ten trades. Six losers at −1R. Four winners at +2R. Net +2R. Win rate 40%. That sample is too small to prove an edge. It is large enough to show the log is pointed at the right thing.
If I only wrote “6 wins,” I would have learned nothing. Probability here means the payoff and the hit rate together, after the rule was followed. Anything else is a story I tell myself between sessions.