In the trading world, market participants usually divide themselves into two fiercely competitive camps: the Fundamental Analysts and the Technical Analysts.
If you spend time on trading forums or financial social media, you will quickly notice the divide. Fundamental analysts often scoff at technical traders, calling chart patterns “astrology for finance.” Meanwhile, technical analysts mock fundamental traders, claiming that by the time an earnings report or economic data point is published, the market has already “priced it in” and left them behind.
The truth? Both camps are missing the bigger picture.
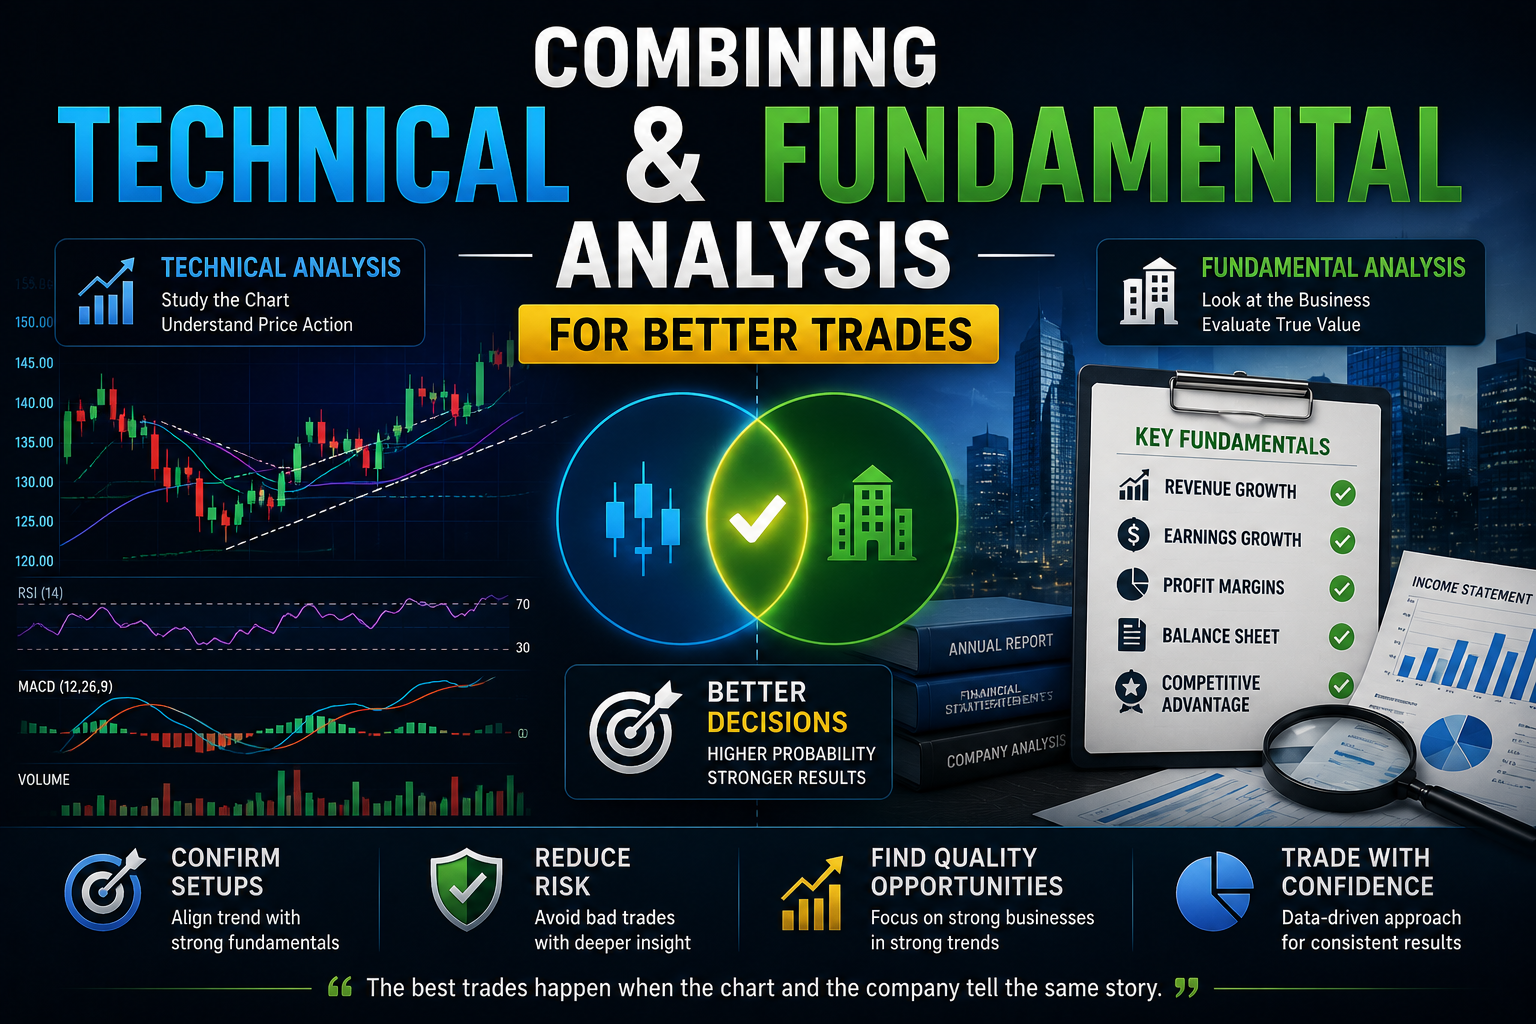
Choosing only one method is like trying to fly an airplane with one wing. To achieve consistent, long-term profitability, the most successful market participants use a hybrid approach. By combining technical and fundamental analysis, you create a powerful trading framework: Fundamentals tell you what to buy or sell, and technicals tell you when to do it.
This comprehensive guide will break down how these two methodologies work together, why their combination reduces your risk, and a step-by-step framework you can implement on your dashboard today.
My Personal Perspective: Unlocking the “Why” Behind Market Movements
As we’ve discussed throughout this journey, learning how markets behave isn’t just about reading indicators or reviewing financial statements in isolation—it’s about understanding the complete story behind why a stock is moving. When I first started navigating the markets, I made the classic mistake of relying too heavily on just one side. I’d see a stock chart breaking out and jump in blindly, only to get crushed by an unexpected earnings revision or macro news event. Conversely, I’ve spent countless hours analyzing a company’s stellar balance sheet, only to buy right before a massive technical correction wiped out weeks of potential gains.
That hard-earned experience taught me a vital lesson: true consistency comes from answering both questions simultaneously. Fundamentals give you the conviction to hold a quality asset through normal market noise, while technicals give you the situational awareness to understand the immediate market sentiment. When you combine them, you stop guessing why a stock is surging or plunging—you can actually see the underlying business catalysts aligning with institutional buying pressure. That synergy is the ultimate edge for any serious trader.
The Two Pillars of Market Analysis
Before we look at how to merge them, let’s briefly define what each pillar brings to the table.
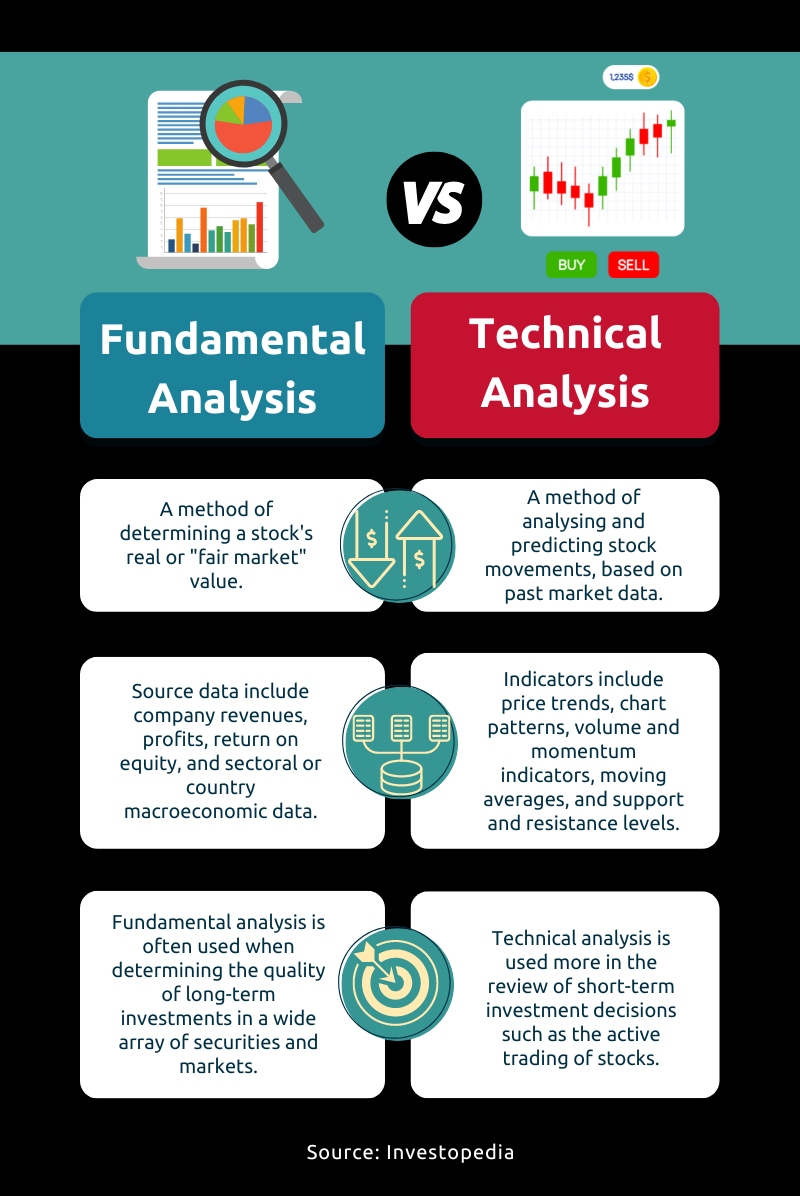
1. Fundamental Analysis: The “What” and “Why”
Fundamental analysis is the study of the underlying forces that affect the economy, industrial sectors, and individual companies or assets. Its ultimate goal is to determine the intrinsic value of an asset to see if it is currently underpriced (a buying opportunity) or overpriced (a selling opportunity).
- In Stocks: This includes looking at revenue, profit margins, Earnings Per Share (EPS), debt-to-equity ratios, macroeconomic interest rates, and management strength.
- In Crypto: This involves evaluating network utility, tokenomics, developer activity, total value locked (TVL), and active wallet addresses.
- In Forex: This means tracking GDP growth, employment data, central bank monetary policy, and inflation rates.
Fundamentals give you conviction. They help you find high-quality assets that have a strong structural reason to move higher over time.
2. Technical Analysis: The “When” and “Where”
Technical analysis completely ignores intrinsic value. Instead, it focuses entirely on market psychology, price action, and volume. Technical analysts study historical charts because human psychology repeats itself, creating predictable patterns.
- Tools Used: Candlestick patterns, support and resistance lines, moving averages (like the SMA or EMA), Volume Weighted Average Price (VWAP), and momentum oscillators (like the RSI).
Technicals give you execution accuracy. They prevent you from buying an amazing asset right before a major technical correction, and they show you exactly where to place your stop-loss to manage your risk.
Why Combining Both Methods Creates Better Trades
Imagine you find a company with flawless fundamentals. Their earnings just grew by 40%, they have zero debt, and they just launched a revolutionary product. You buy immediately. However, you didn’t look at the chart. If the stock’s Relative Strength Index (RSI) was sitting at an extreme overbought level of 85, and the price was severely overextended above its 200-day moving average, the stock is highly likely to experience a sharp technical pullback. Your fundamental trade is immediately in the red.
Conversely, imagine you see a perfect “Double Bottom” chart pattern on a stock, indicating a bullish reversal. You buy the breakout. But you didn’t check the calendar: the company is scheduled to report disastrous earnings the very next morning. The stock gaps down 15% at the open, blowing right past your stop-loss.
By blending both styles, you eliminate these blind spots. You use fundamentals as a macro filter to build a watchlist of great assets, and you use technicals as a micro trigger to enter and exit those assets safely.
The Step-by-Step Hybrid Trading Framework
Here is a practical, step-by-step workflow you can use to combine both disciplines into a singular trading strategy.
Step 1: Filter the Market Using Fundamentals
Start your week by looking for assets that have a clear fundamental catalyst or a structural imbalance in value. You want to answer the question: Which assets have the wind at their back?
- Look for Fundamental Catalysts: Is a company about to report earnings that are expected to beat expectations? Is a cryptocurrency undergoing a major network upgrade that reduces supply? Is a central bank cutting interest rates, which historically pumps liquidity into that specific currency’s stock market?
- Build Your Watchlist: Filter out the noise. If an asset has messy fundamentals, declining revenue, or heavy regulatory headwinds, keep it off your list—no matter how enticing the chart looks.
Step 2: Locate Key Technical Levels
Once you have your fundamental watchlist (e.g., three high-growth stocks or highly utilized commodities), open up your charting platform. Your goal now is to wait patiently for price action to align with your fundamental thesis.
- Find the Trend: Ensure the technical trend matches the fundamental bias. If your fundamental research says an asset should go up, make sure the price is trading above its 50-period or 200-period moving average. Never fight a strong technical markdown, even if you love the fundamentals.
- Identify Support Zones: Do not chase a stock when it is breaking out into vertical “FOMO” runs. Wait for a healthy technical pullback to a major daily support level, a trendline, or a dynamic indicator like the VWAP.
Step 3: Identify the Technical Trigger
Now that the fundamentally strong asset has pulled back to a key technical support level, you look for a validation trigger to execute the trade.
- Look for Reversal Candles: Watch for bullish price action signals, such as a hammer candlestick, a bullish engulfing pattern, or a sudden surge in buying volume at the support line. This proves that the market’s big institutional players are stepping in to defend that price level.
- Execute with Precise Risk Management: Because you are using technicals, you don’t have to guess where to exit if you are wrong. Place your stop-loss right below the technical support level. If the fundamentals are strong but the technical level breaks, the market is telling you that your timing is off, and it’s safer to step aside.
Real-World Example: The Corporate Earnings Play
Let’s look at how this looks in practice during a corporate earnings season:
- The Fundamental Catalyst: Company XYZ reports spectacular quarterly earnings, beating Wall Street estimates by 15%, and raises its financial guidance for the rest of the year. The stock gaps up aggressively on high volume.
- The Technical Patience: Instead of buying the opening gap-up at an overextended price, the hybrid trader waits. Over the next week, short-term traders take their profits, causing the stock price to slowly drift downward.
- The Convergence: The stock drifts down until it perfectly touches its upward-sloping 20-day Exponential Moving Average (EMA), which happens to align with the price level of the original earnings gap.
- The Trade: The trader spots a bullish rejection candle at the 20-day EMA. The fundamental story hasn’t changed (the company is still highly profitable), but the technical risk-to-reward ratio is now perfect. The trader enters long, placing a tight stop-loss just underneath the moving average.
Conclusion: The Complete Trader
Relying solely on charts leaves you vulnerable to unexpected macroeconomic shocks, news events, and systemic market shifts. Relying solely on balance sheets leaves you vulnerable to terrible market timing, agonizing drawdowns, and capital inefficiency.
When you combine technical and fundamental analysis, you stop guessing. You gain the macroeconomic confidence required to hold through normal market volatility, combined with the surgical precision needed to protect your account balance when a trade goes invalid. Treat fundamentals as your compass and technicals as your radar—using both is how you truly master the market.
Disclaimer: Content on traderslook.com is for educational and informational purposes only and should not be construed as professional financial advice.