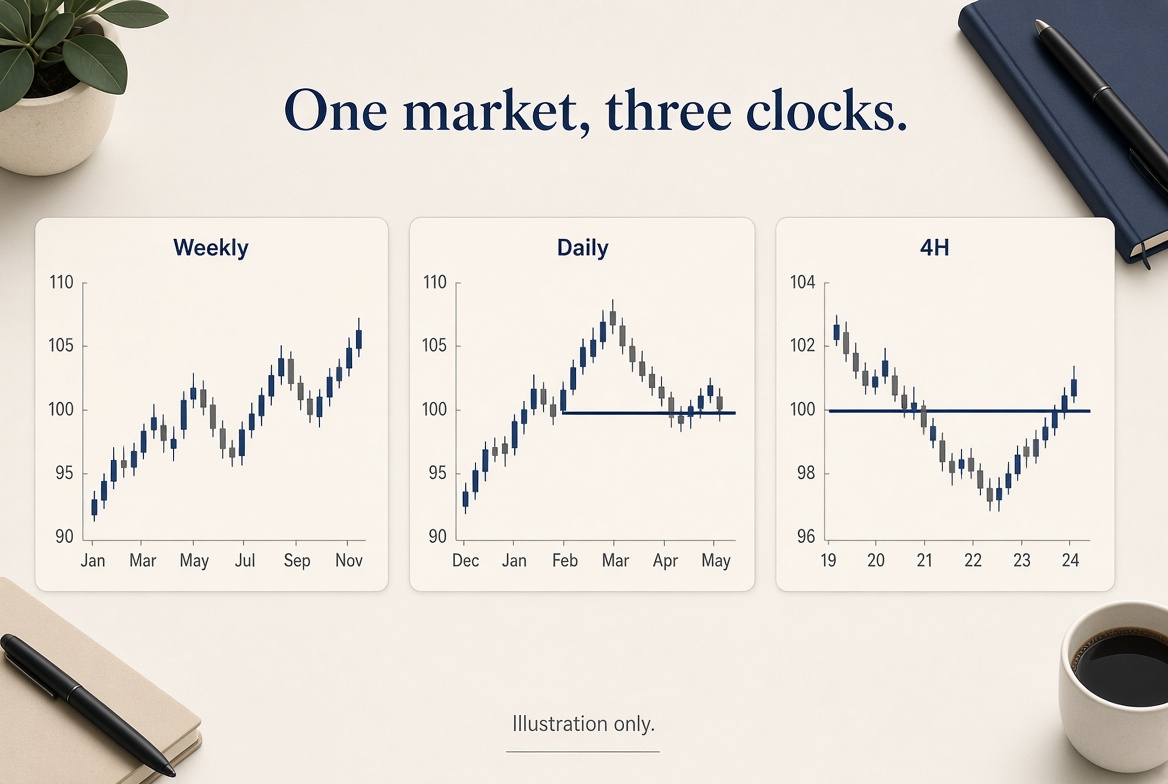
Most of the damage I have done with charts came from adding timeframes until one of them agreed with me.
I now allow three, of one market.
1. Weekly — the story
Is last week’s candle a continuation, a range, or a reversal attempt? I mark high, low, close. I do not trade the weekly. I just refuse to fade a weekly close with a 15-minute opinion. That is the Sunday map in one pane.
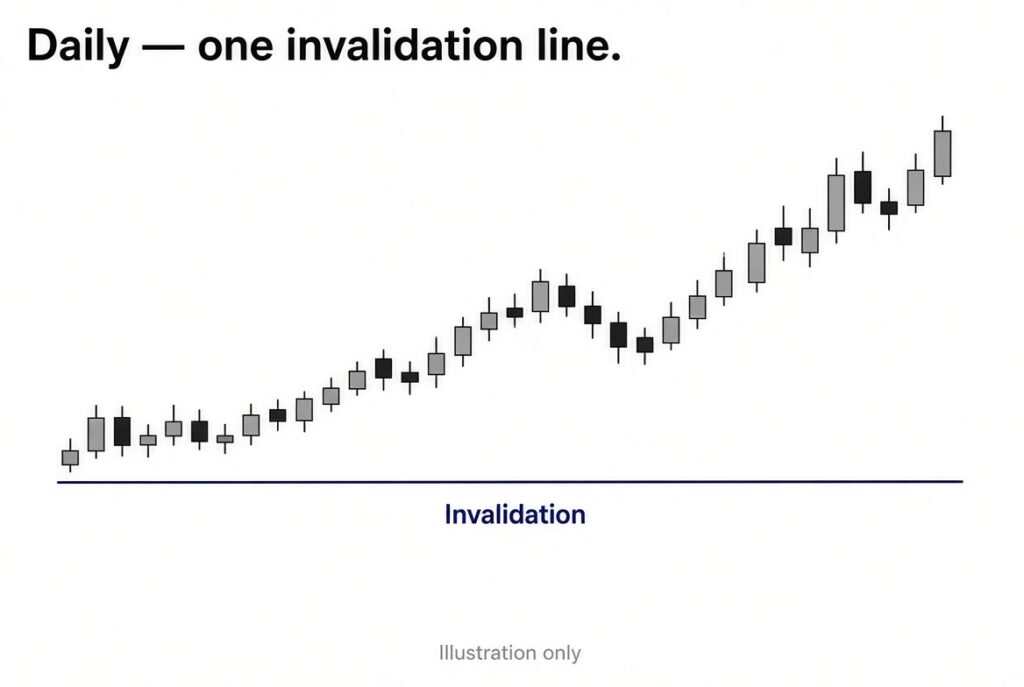
2. Daily — invalidation
The daily holds the line that ends the story. If that line goes, I am done talking about the idea, even if the execution chart still “looks long.”
3. Execution — the turn
This is the only chart that may generate an order. For swing work I like 4H or daily itself. For session work, 15m or 5m. I pick one and live with it for a month. Switching execution charts mid-week is how I manufacture extra setups.
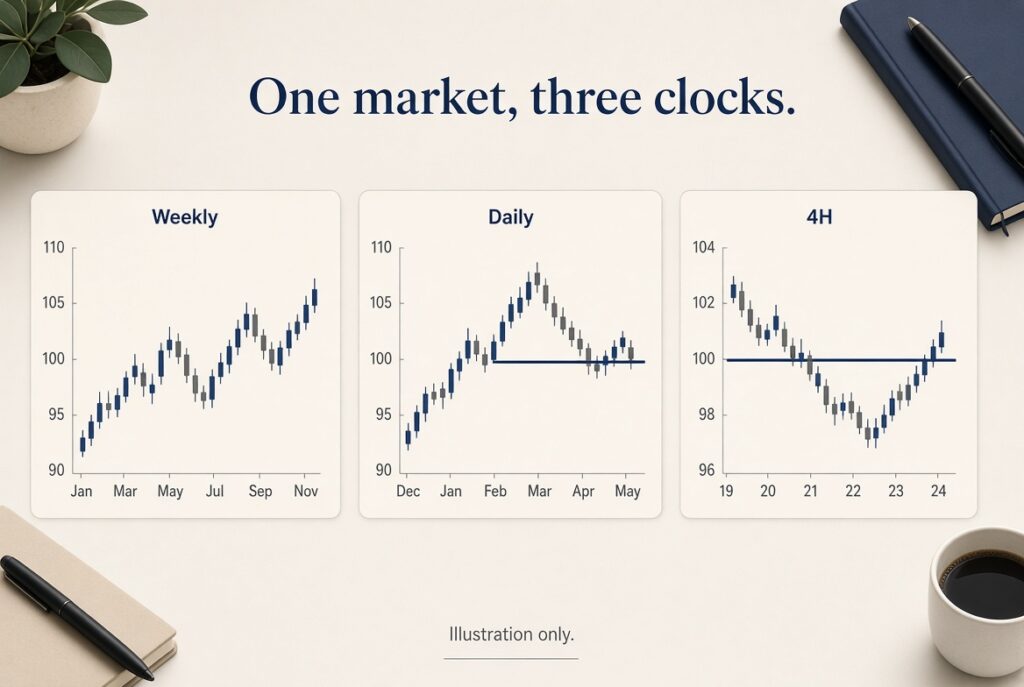
The longer walkthrough is here: multiple timeframe analysis. This note is the reduced version I actually leave open.
The alignment rule
I want the execution turn to point the same way as the daily story. I do not need the weekly, daily, and 5-minute to chant together. I need:
– Weekly not screaming the opposite
– Daily invalidation intact
– Execution chart giving a place to put risk
If those three disagree, I do not average the opinions. I pass.
What I removed
– A 1-minute chart “just to refine”
– A second market “for correlation”
– Four oscillators that reset on every timeframe
Correlation can wait until the first market is under control. Indicators can wait until the structure is written down. Tools I still keep are listed in the free tools piece. None of them need six clocks.
A simple test
If I cannot screenshot the workspace without zooming out of a mess, I have too many panes. Three charts should be readable on a laptop. If they are not, the process is too heavy for the session I actually have.
Pick the market you will still care about in three months. Give it three clocks. Leave the other tabs closed for a week and see whether your journal gets quieter. Quiet is the point.