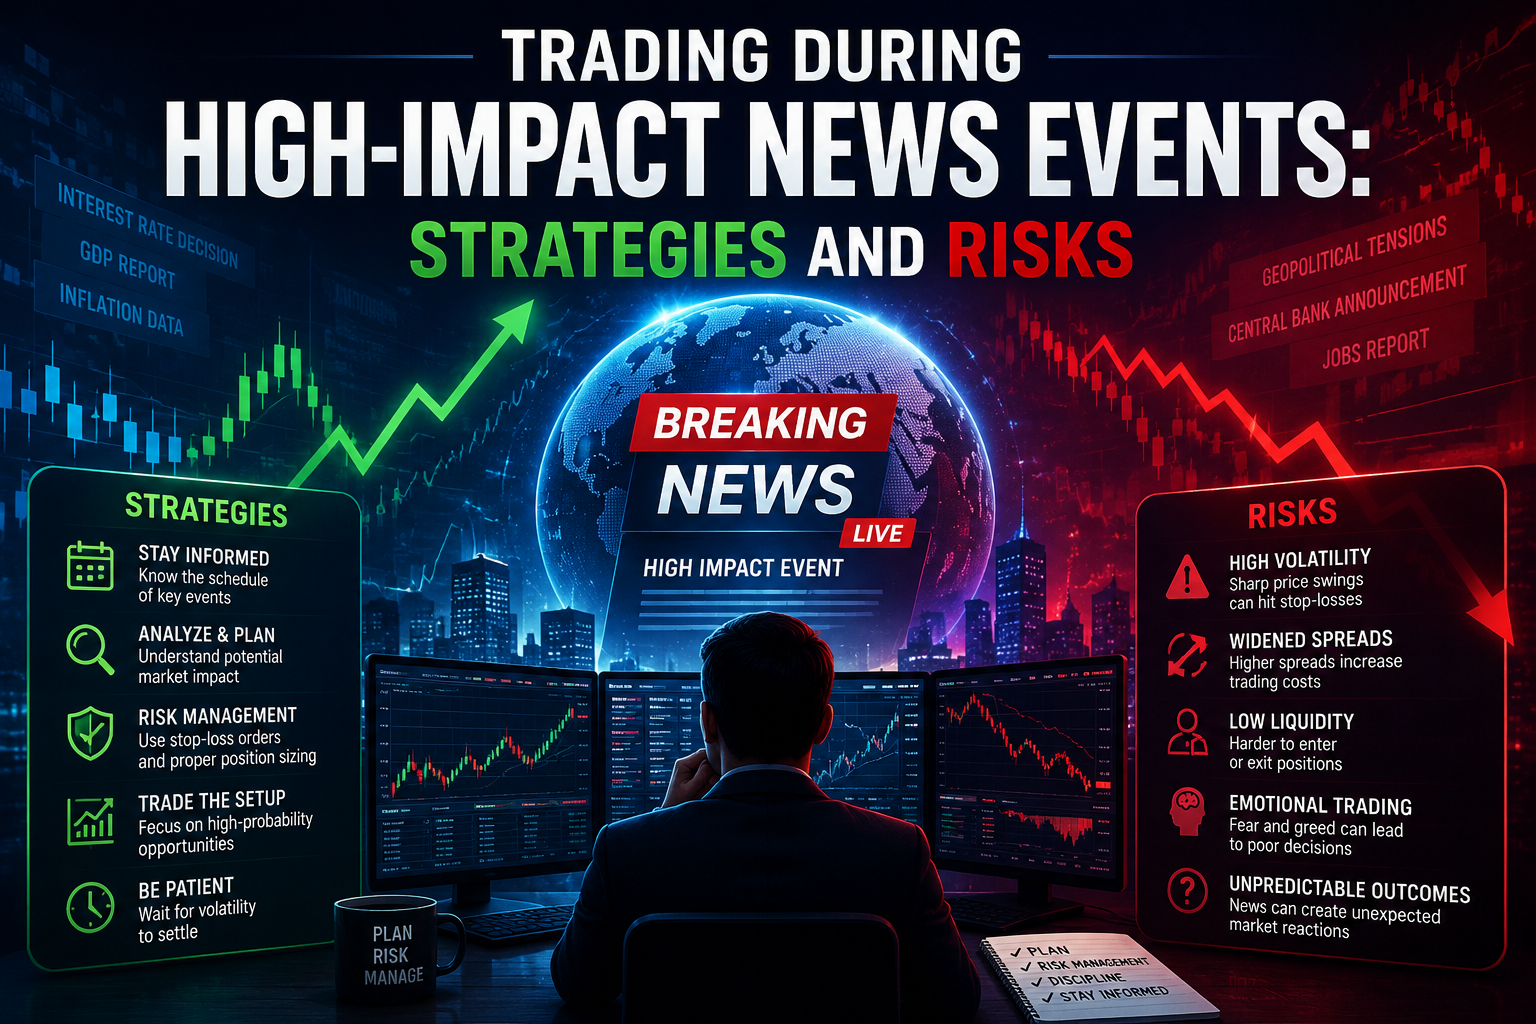
High-impact news events are among the most volatile and profitable — yet also the most dangerous — moments in the financial markets. Whether it’s a Federal Reserve interest rate decision, Non-Farm Payrolls (NFP) report, CPI inflation data, or major corporate earnings, these releases can cause massive price swings in seconds. Many beginners get burned during … Read more
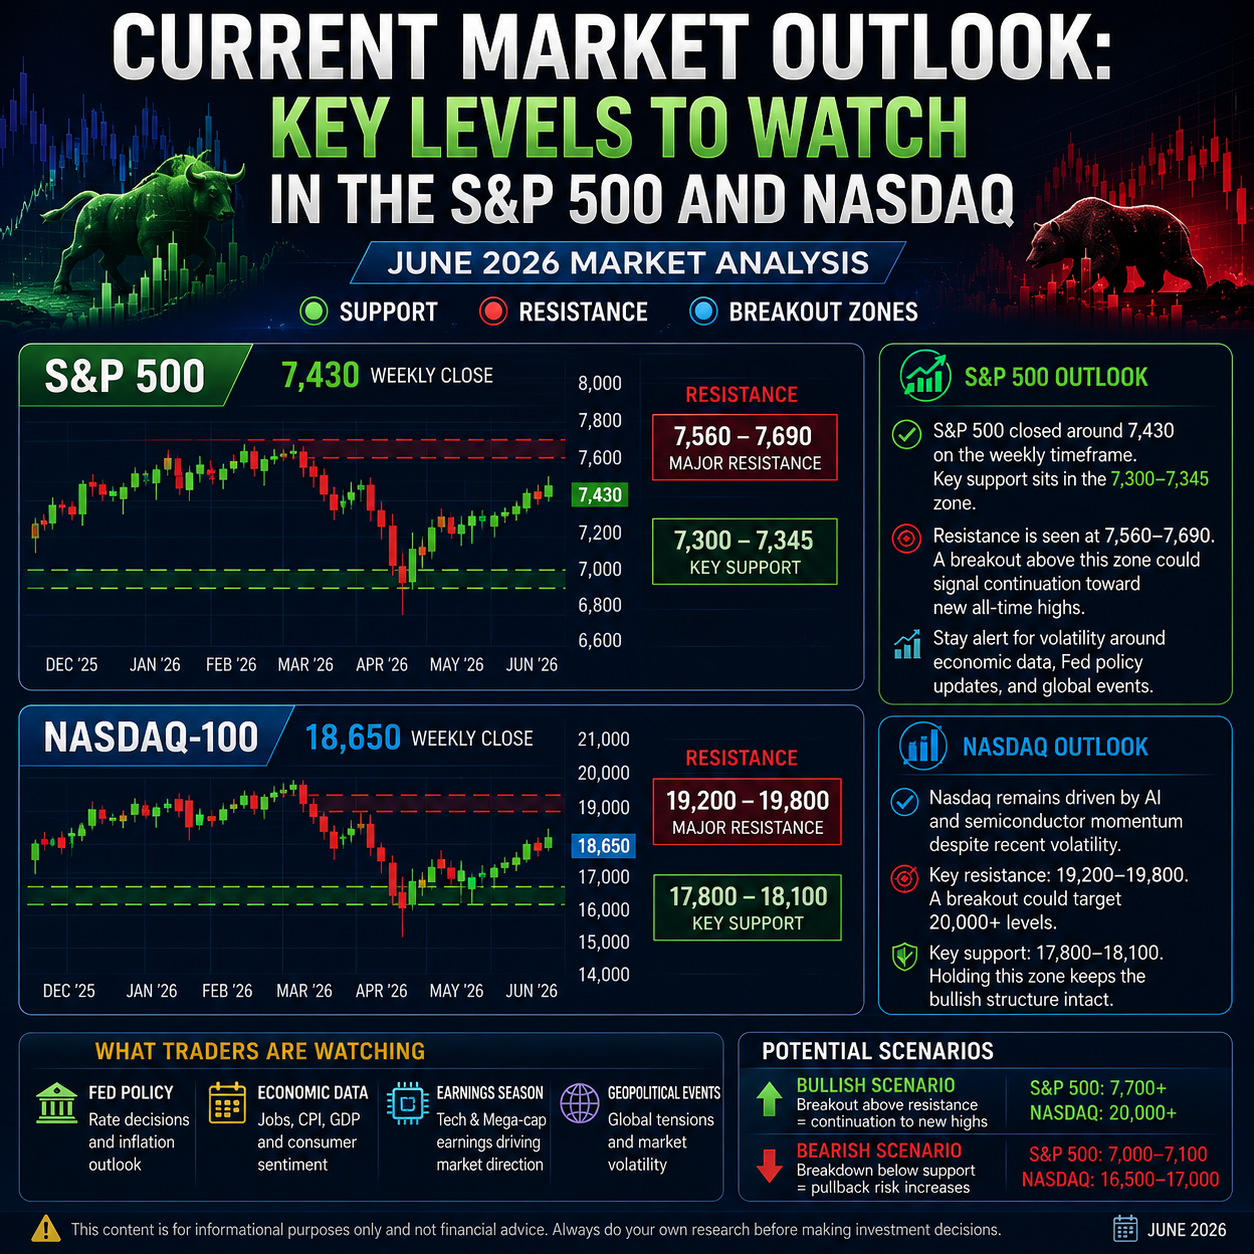
As of mid-June 2026, the U.S. stock market is in a consolidation phase following a strong rally earlier in the year. The S&P 500 and Nasdaq have pulled back from recent highs amid profit-taking, mixed economic signals, and geopolitical developments. In this post, we’ll provide a clear technical outlook with key support and resistance levels … Read more
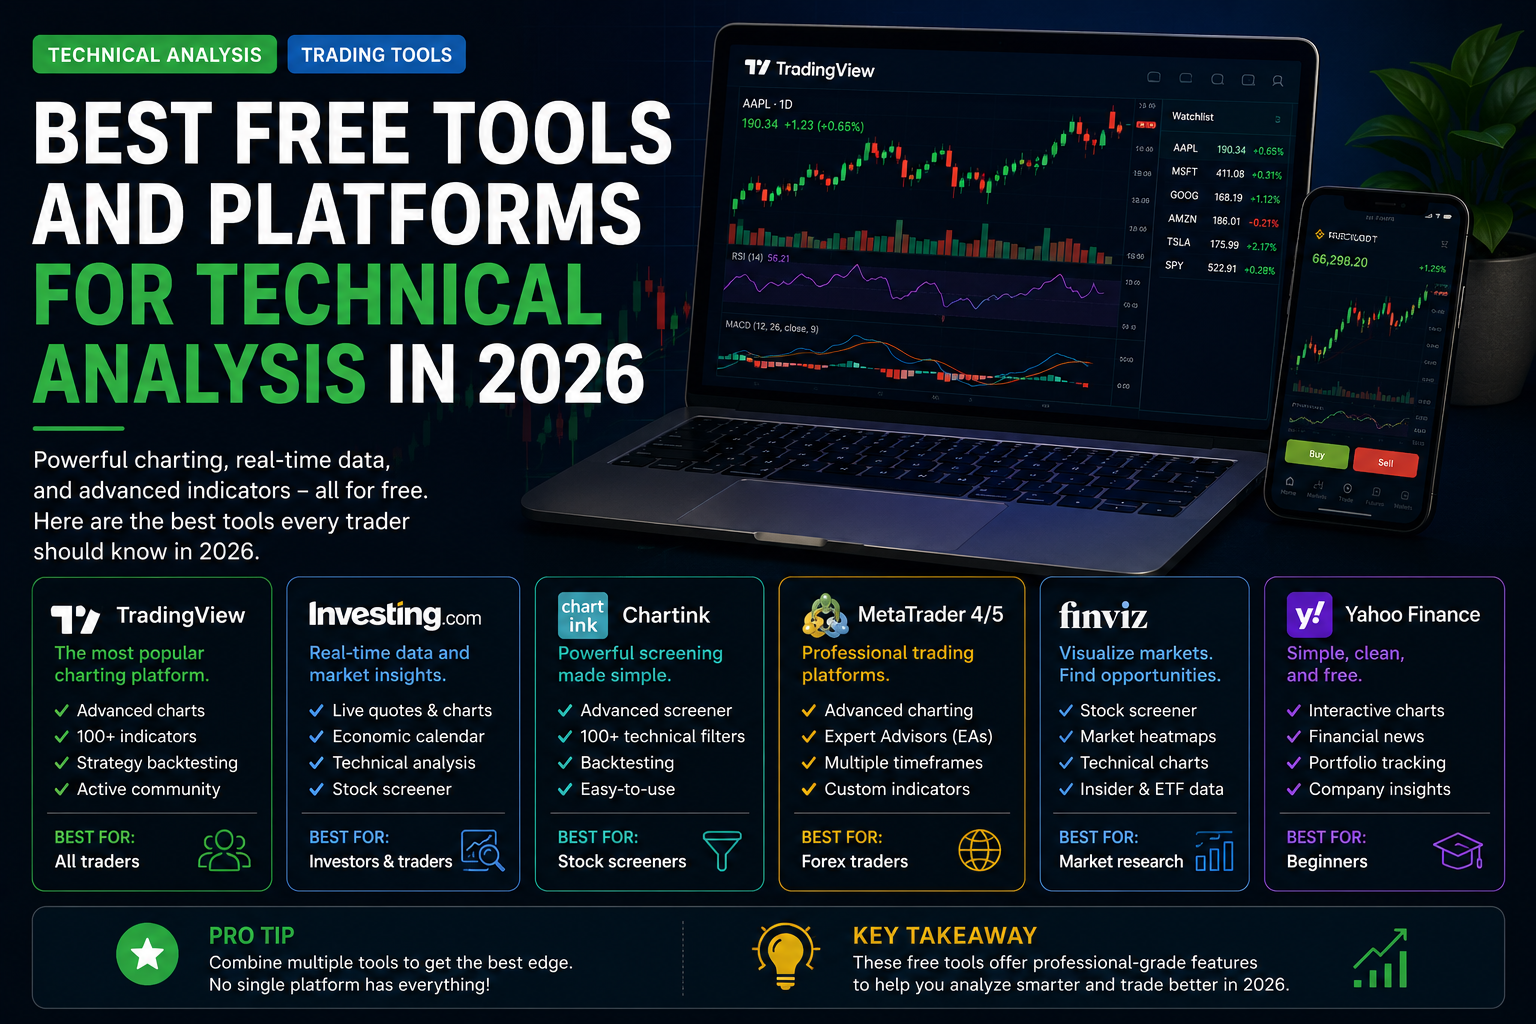
Having the right tools can significantly improve your trading efficiency without spending a dime. In 2026, there are excellent free (or generous free-tier) platforms that offer professional-level charting, indicators, screening, and backtesting capabilities. This guide covers the best free technical analysis tools for stocks, forex, crypto, and futures, based on current features, usability, and trader … Read more
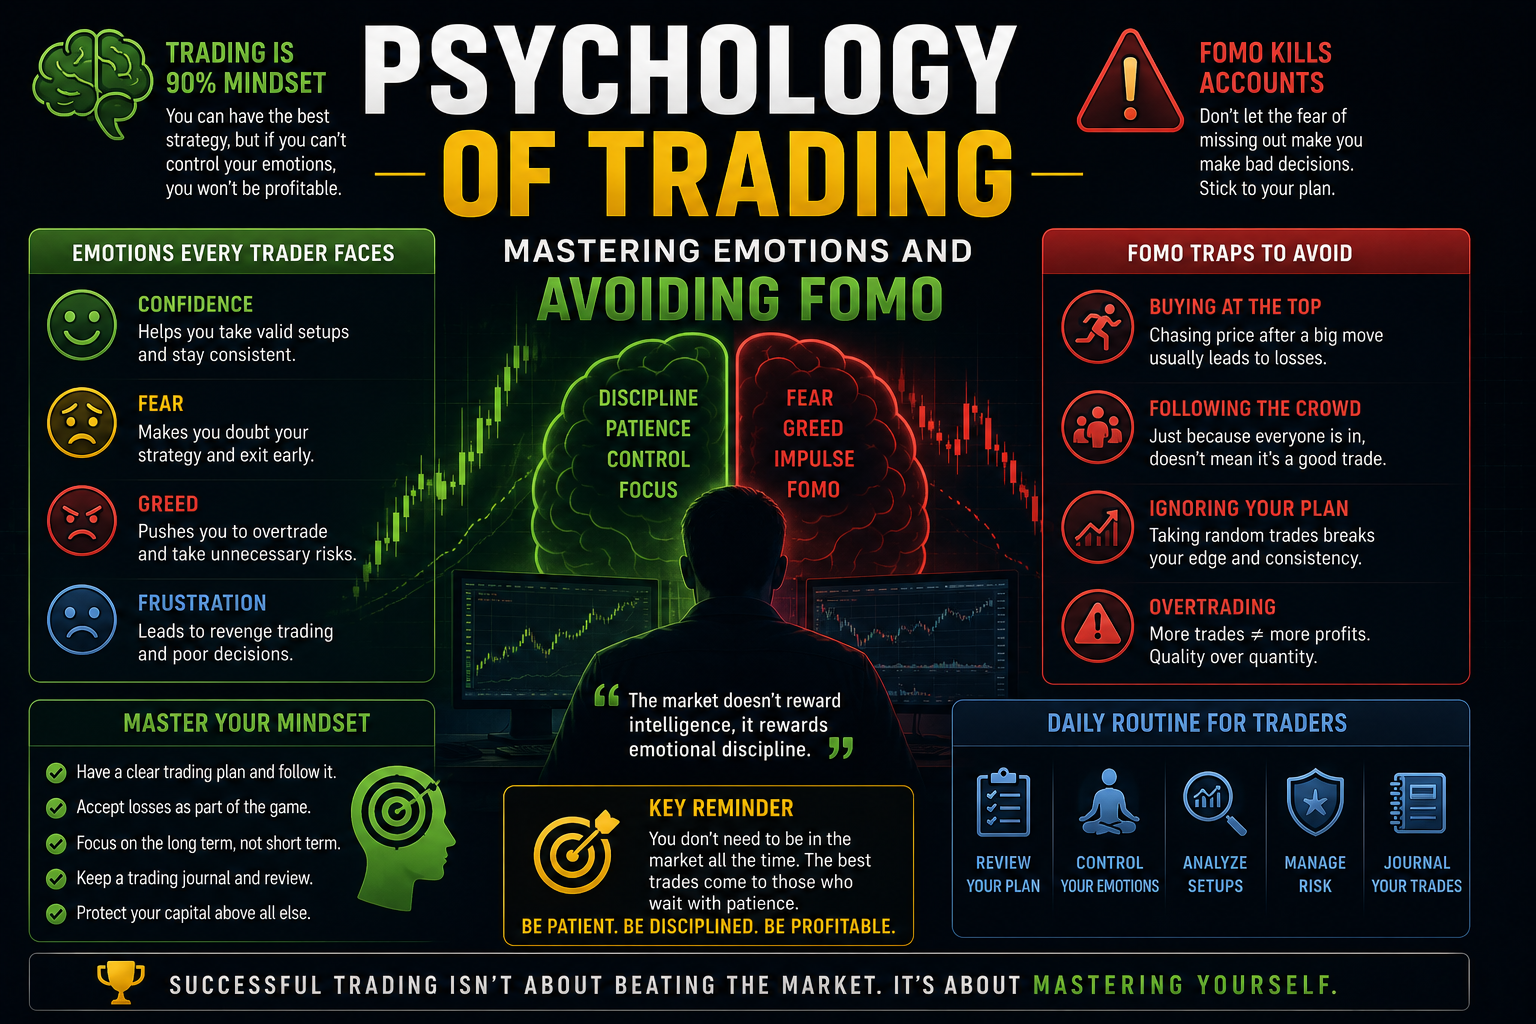
FOMO is not a personality flaw. It is what happens when a moving candle is allowed to vote. I still feel it. The difference is whether that feeling can send an order. The plan and the checklist exist so the feeling has nowhere to click. What FOMO looks like on a desk – Entering after … Read more
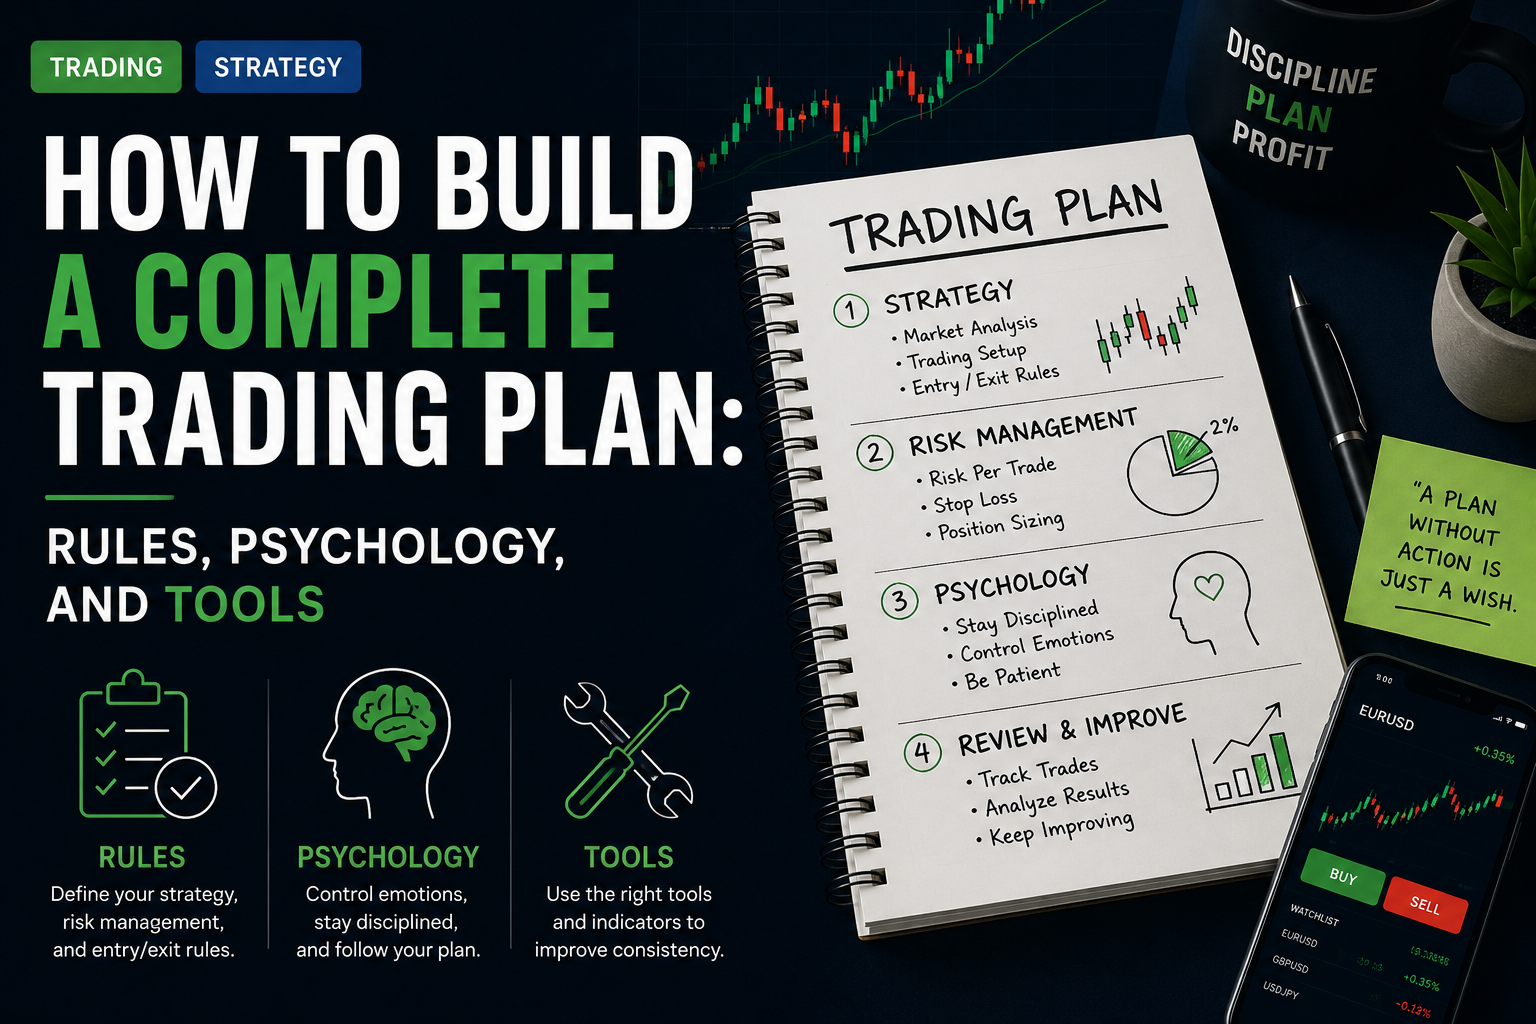
A trading plan is the document you obey when the chart is exciting. If it only exists in your head, it will change every session. Mine is one page plus the checklist. If it needs a binder, I will not read it at the open. What the page must contain 1. Style and hours Swing or … Read more
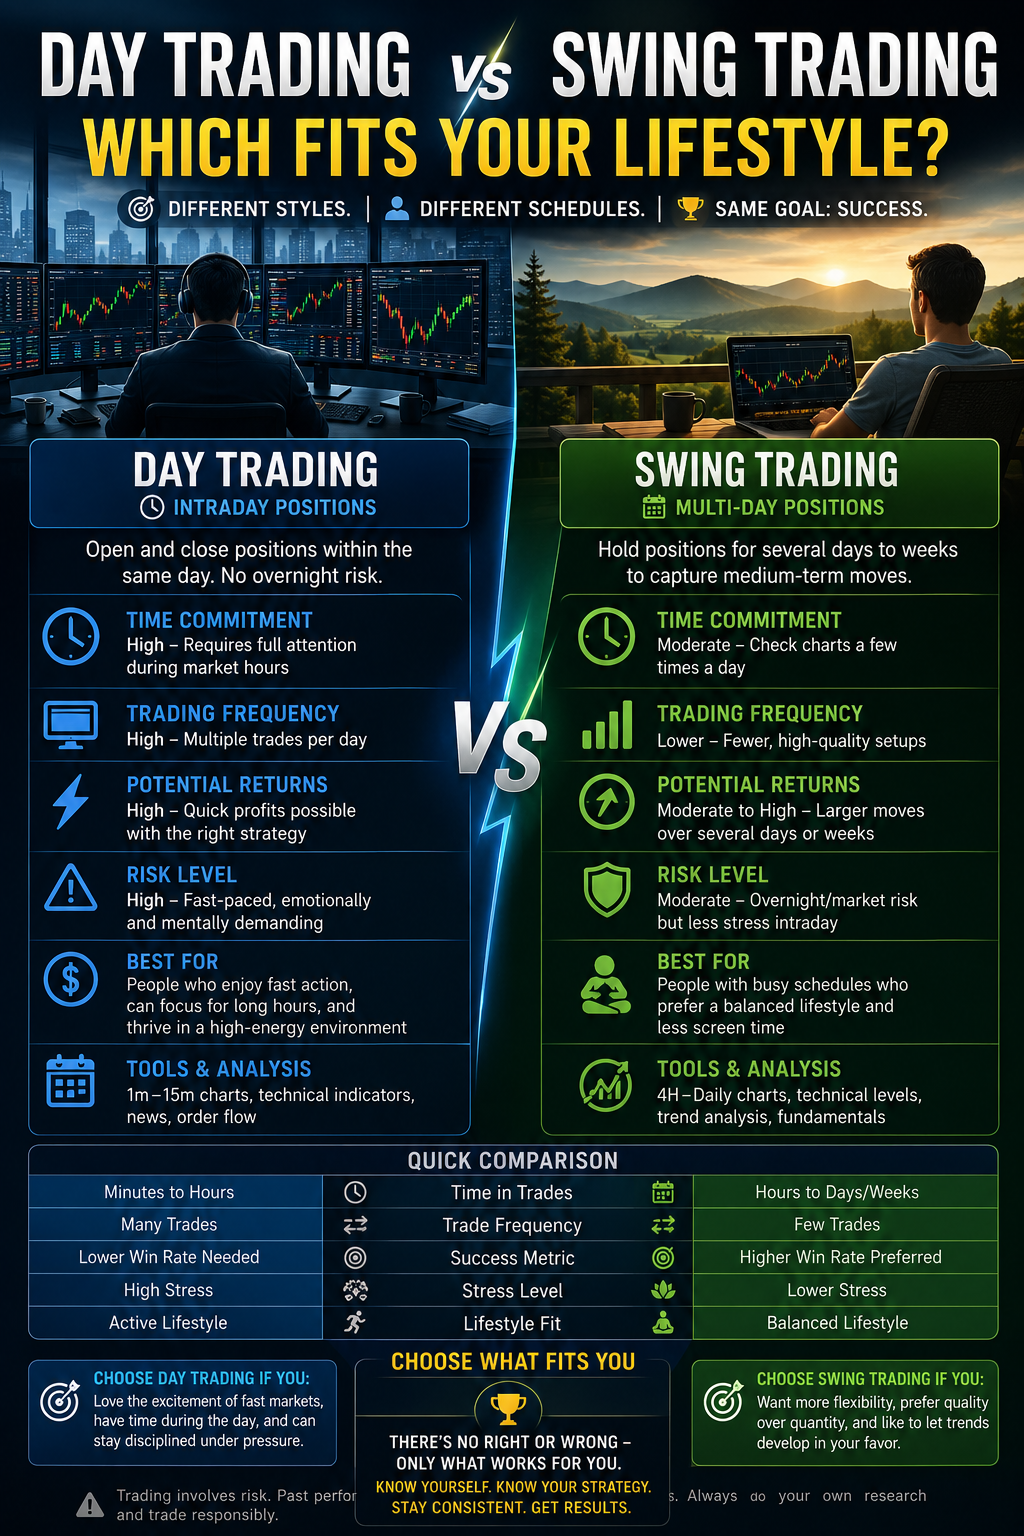
Style is a calendar problem before it is a strategy problem. If you have 40 minutes after work, you do not have a day-trading job. You have a window. Forcing 5-minute charts into that window is how swing rules die and FOMO gets a time stamp. Two jobs Day / session You are in front … Read more
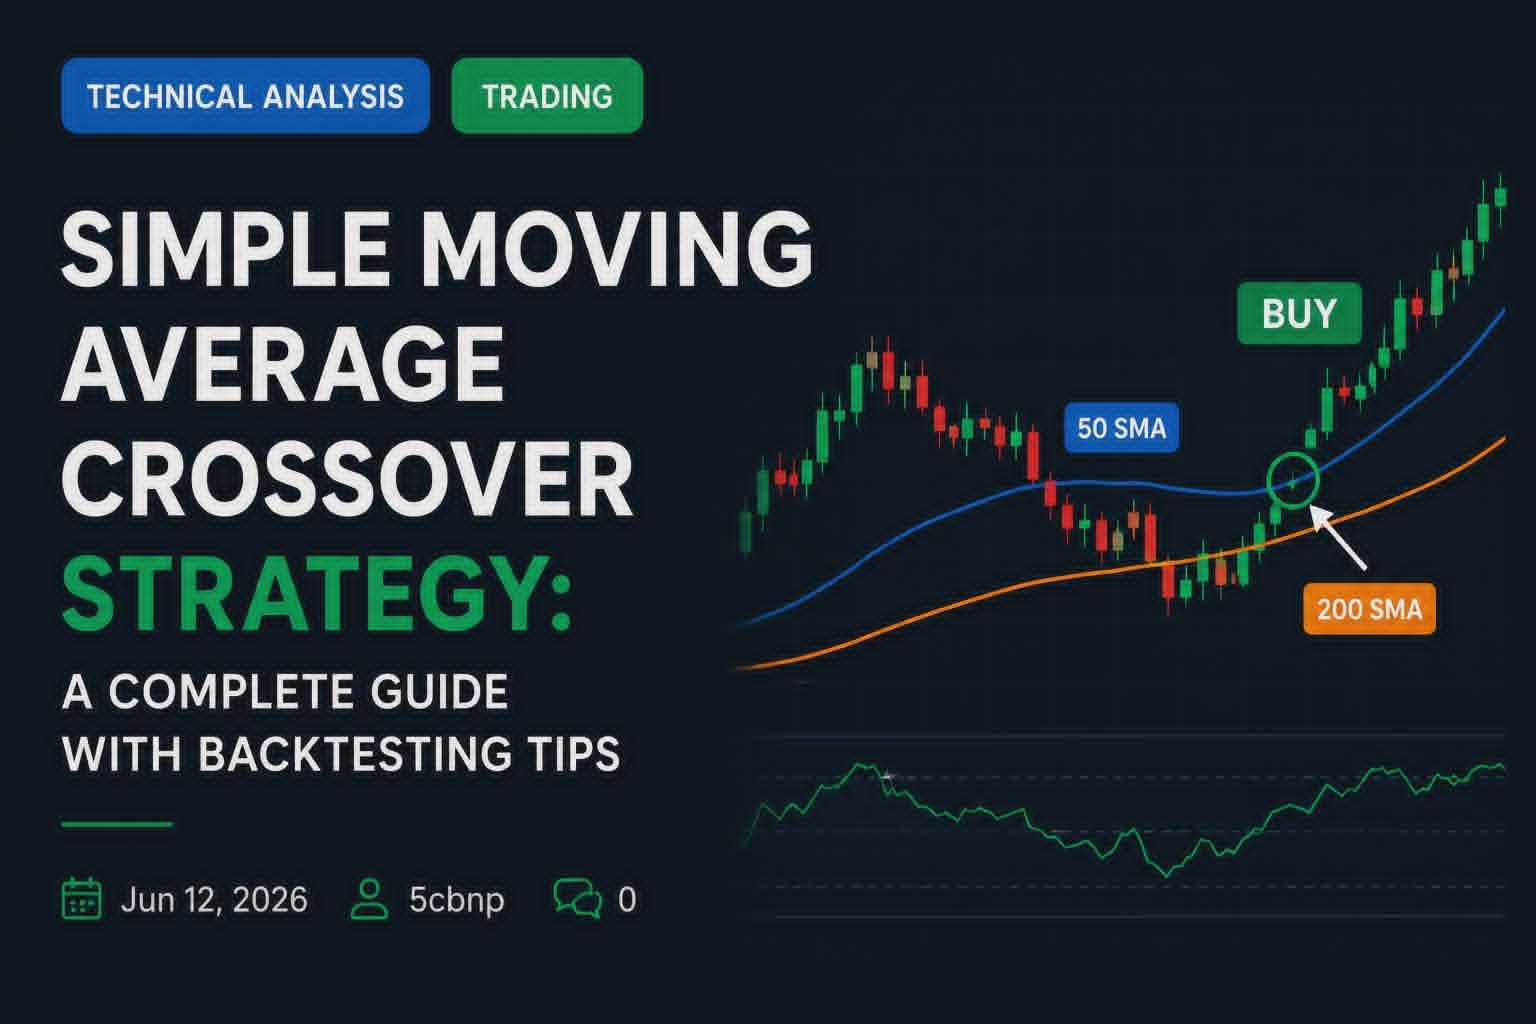
The Simple Moving Average (SMA) Crossover Strategy is one of the most popular and beginner-friendly trading strategies in technical analysis. It is easy to understand, rule-based, and works across stocks, forex, crypto, and futures. This strategy uses two moving averages of different lengths to generate clear buy and sell signals. In this comprehensive guide, you’ll … Read more
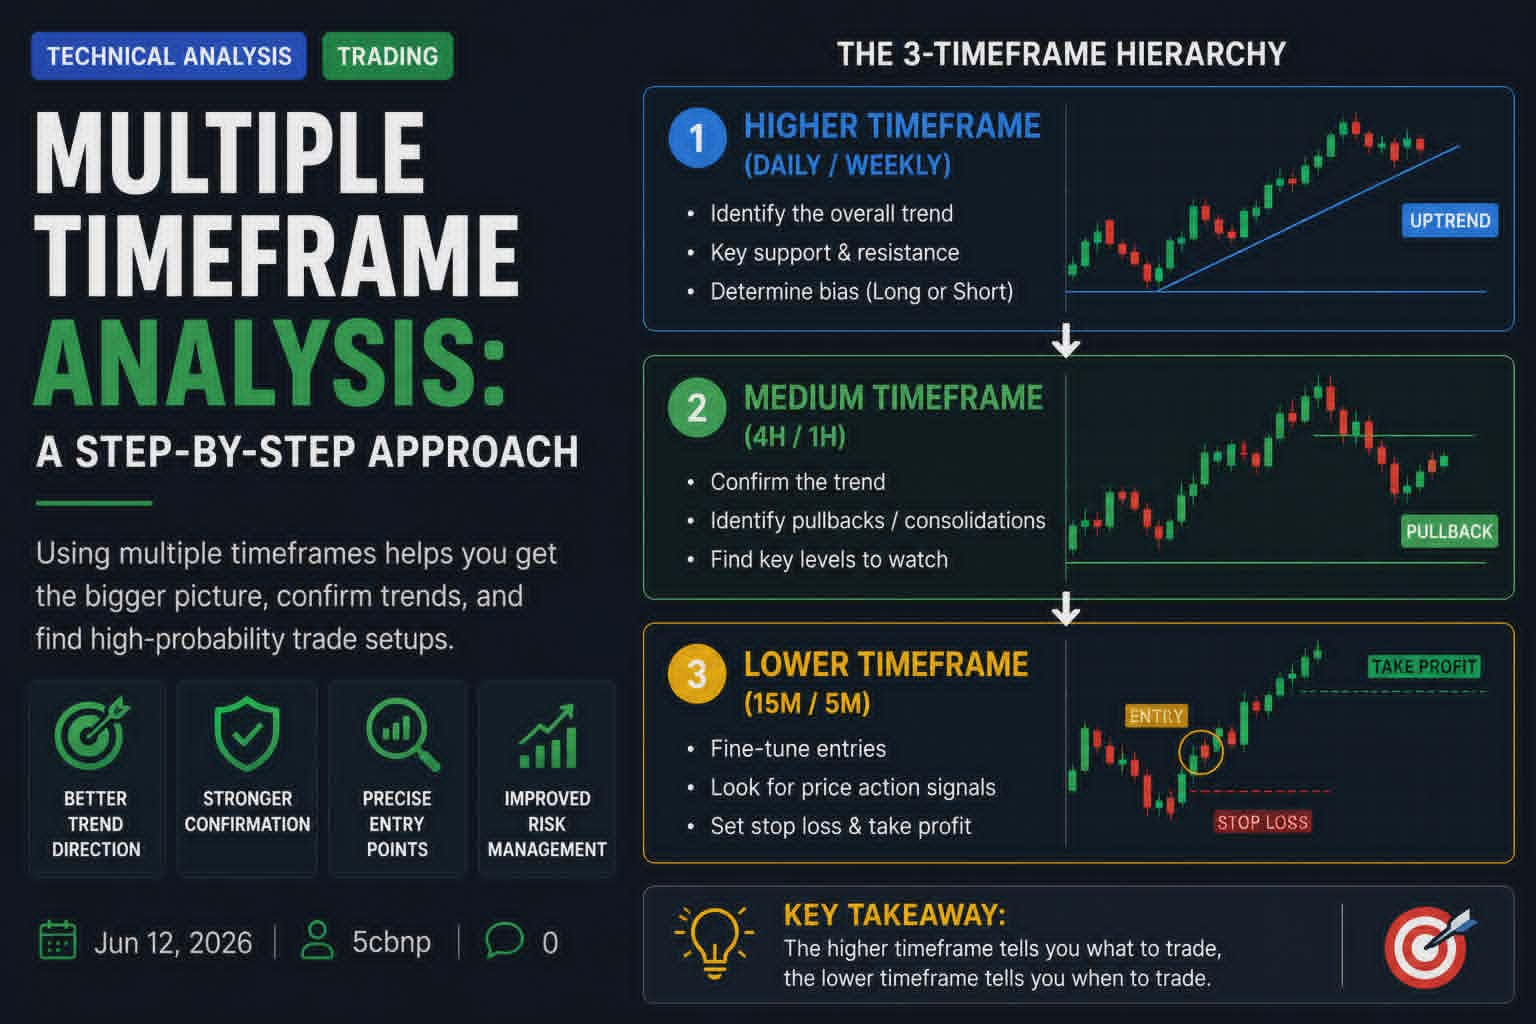
Multiple timeframes are useful until they become a way to find a chart that agrees with you. I use three clocks of one market. I wrote the short version as one market, three timeframes. This page is the fuller walkthrough. The stack Weekly Story of last week’s auction: high, low, close. I do not place … Read more
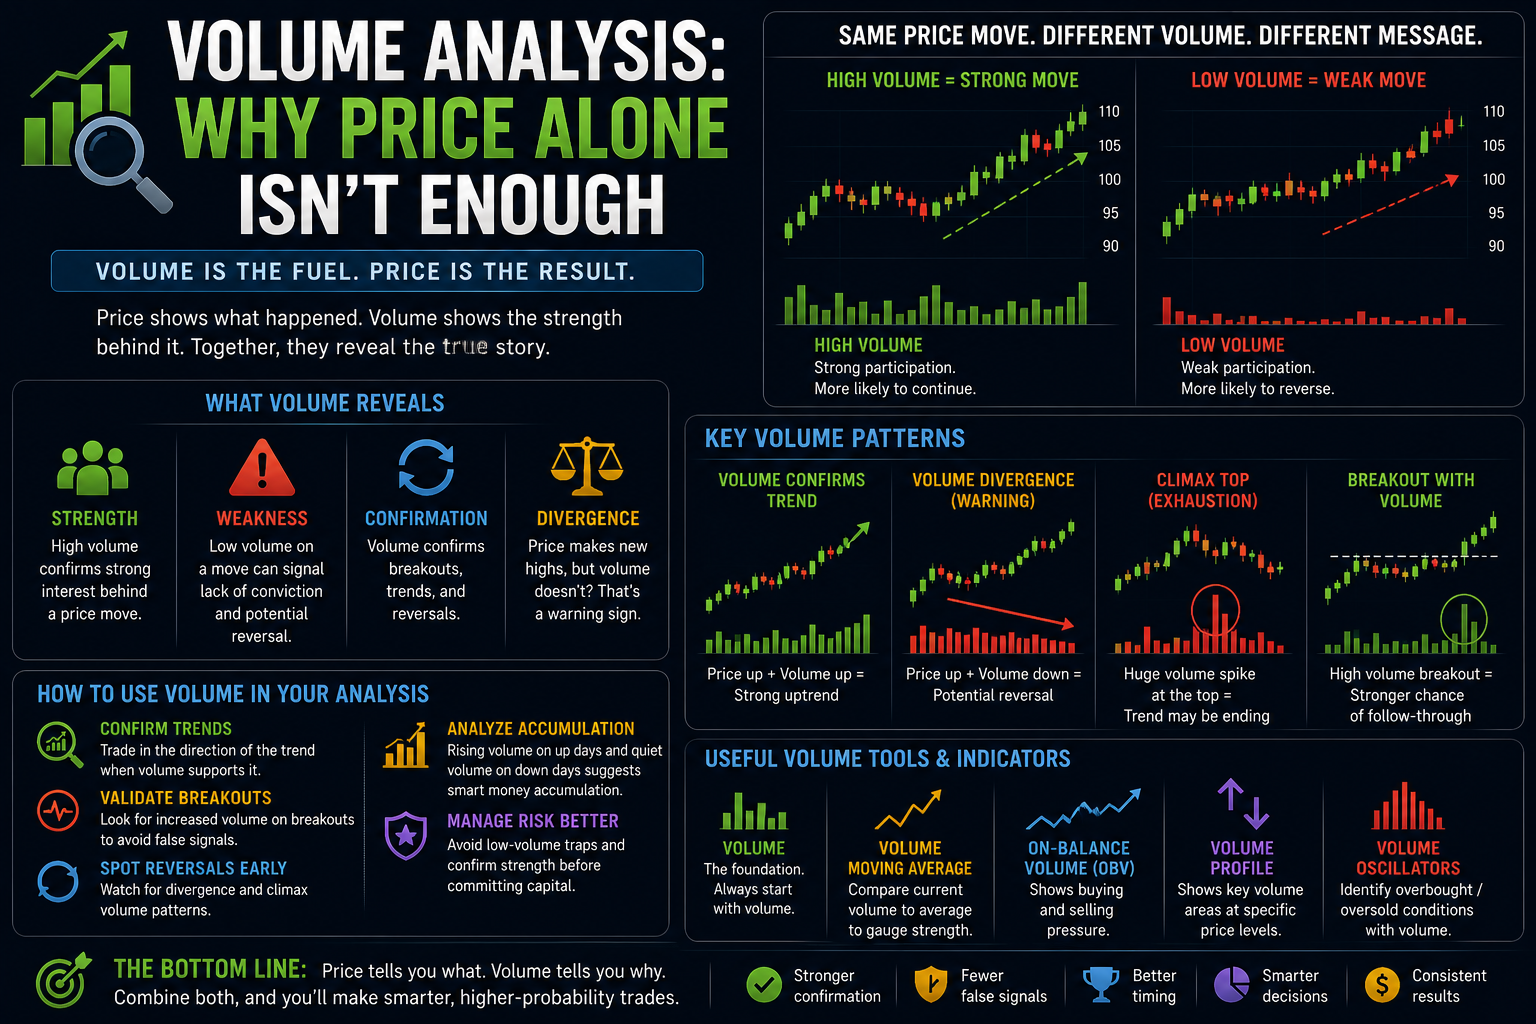
Price is what most beginners focus on when analyzing charts. However, professional traders know that volume is the fuel that drives price movements. Understanding volume analysis can dramatically improve your ability to confirm trends, spot reversals, and avoid false breakouts. In this comprehensive guide, you’ll learn what volume really means, how to interpret it alongside … Read more
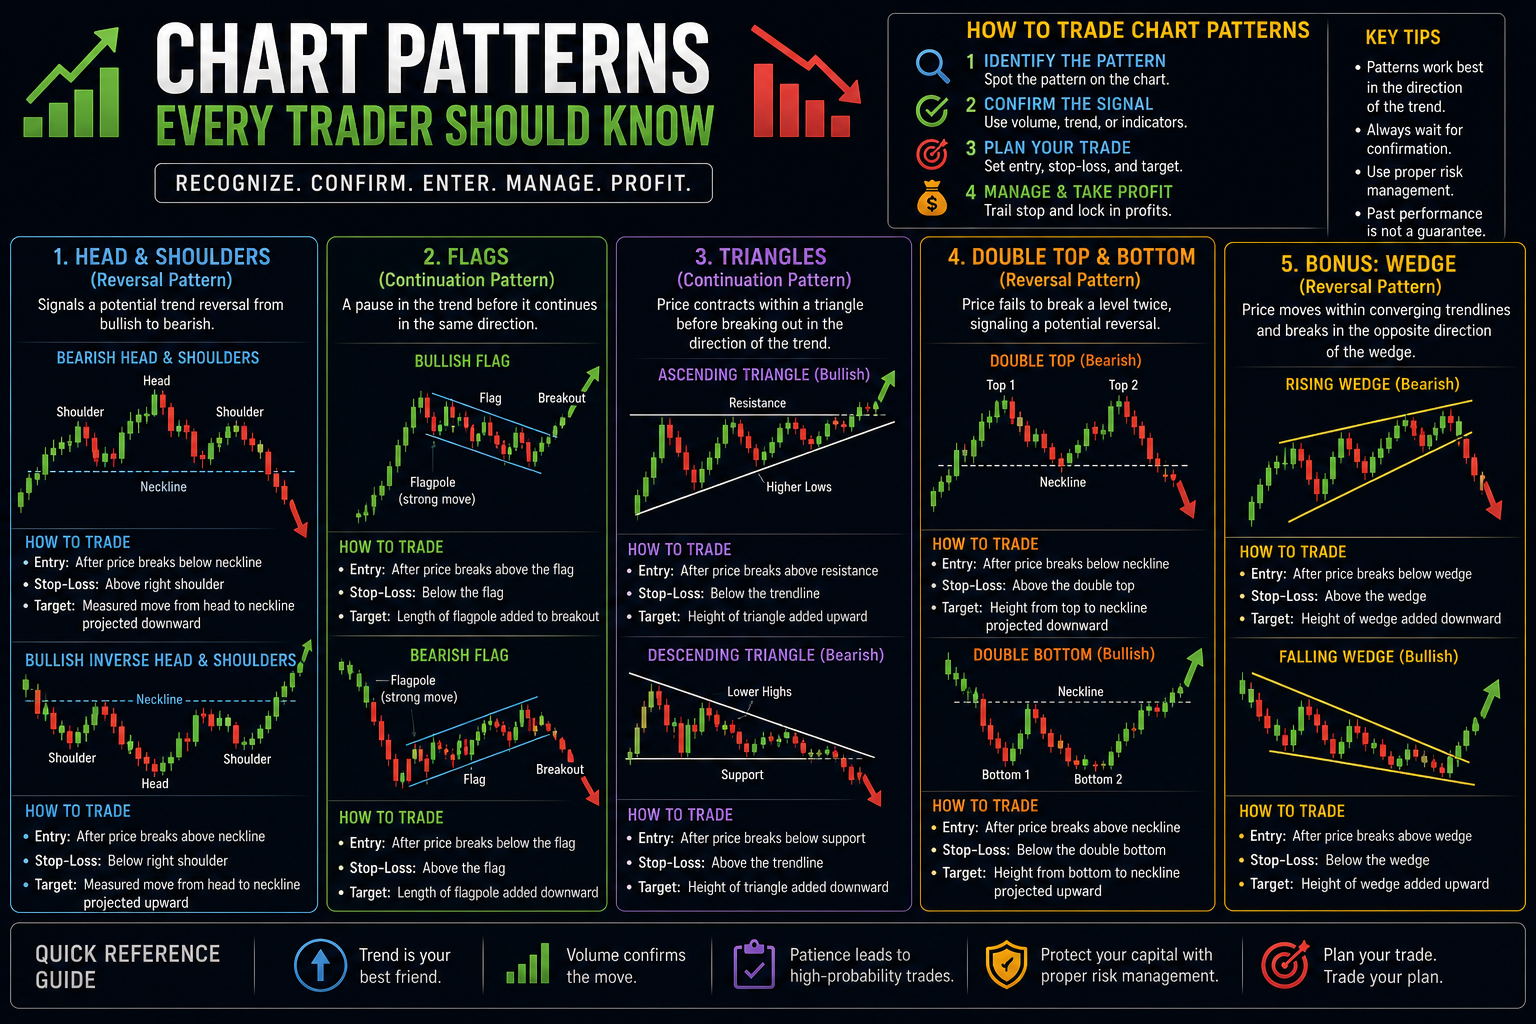
Chart patterns are the foundation of price action trading. They form when price movements create recognizable shapes that often signal future direction with high probability. Learning to spot these patterns gives traders a significant edge in predicting reversals and continuations. In this comprehensive guide, we’ll cover the most important chart patterns every trader should know: … Read more
Content on traderslook.com is for educational and informational purposes only and should not be construed as professional financial advice
"As an Amazon Associate I earn from qualifying purchases"