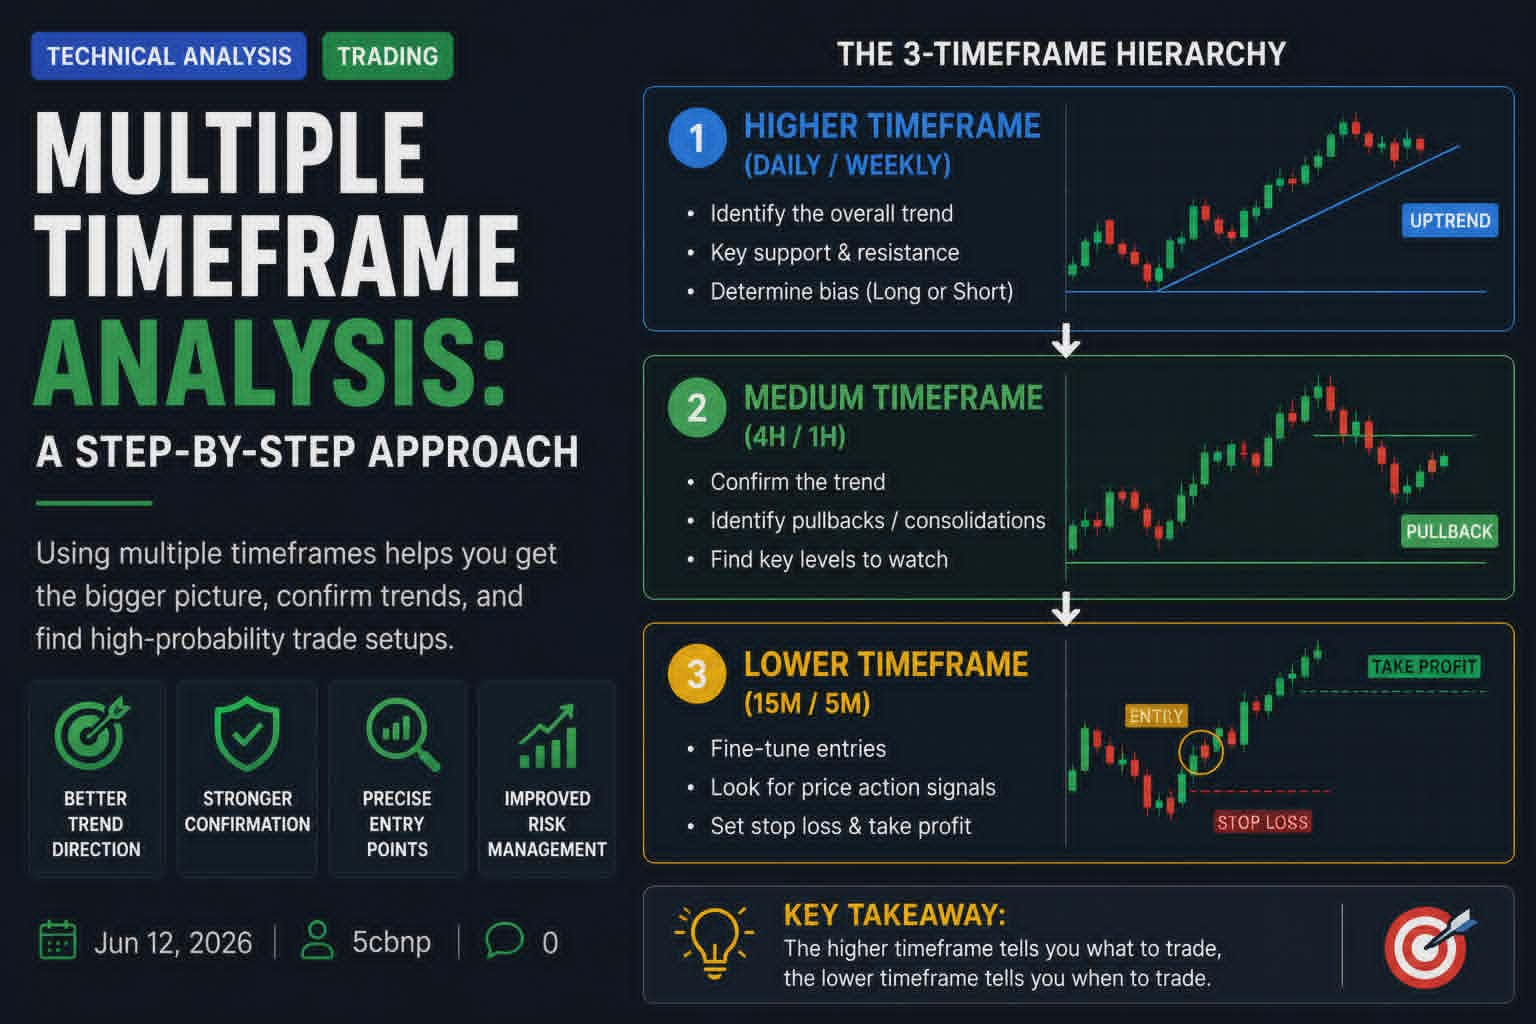
Multiple timeframes are useful until they become a way to find a chart that agrees with you. I use three clocks of one market. I wrote the short version as one market, three timeframes. This page is the fuller walkthrough. The stack Weekly Story of last week’s auction: high, low, close. I do not place … Read more
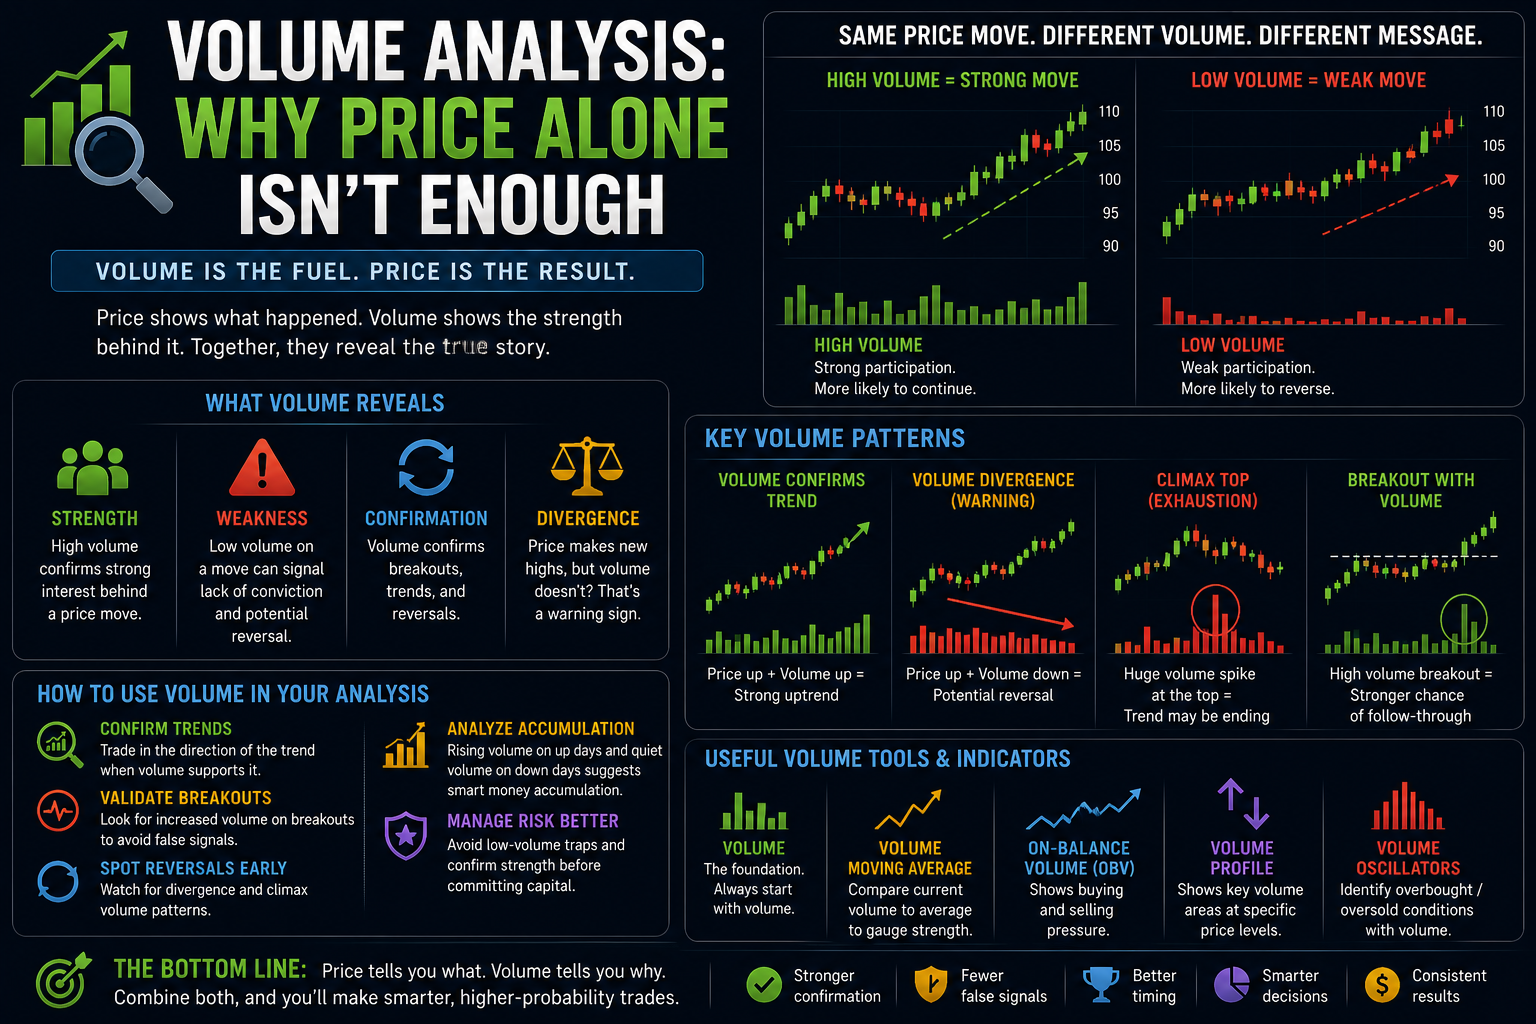
Price is what most beginners focus on when analyzing charts. However, professional traders know that volume is the fuel that drives price movements. Understanding volume analysis can dramatically improve your ability to confirm trends, spot reversals, and avoid false breakouts. In this comprehensive guide, you’ll learn what volume really means, how to interpret it alongside … Read more
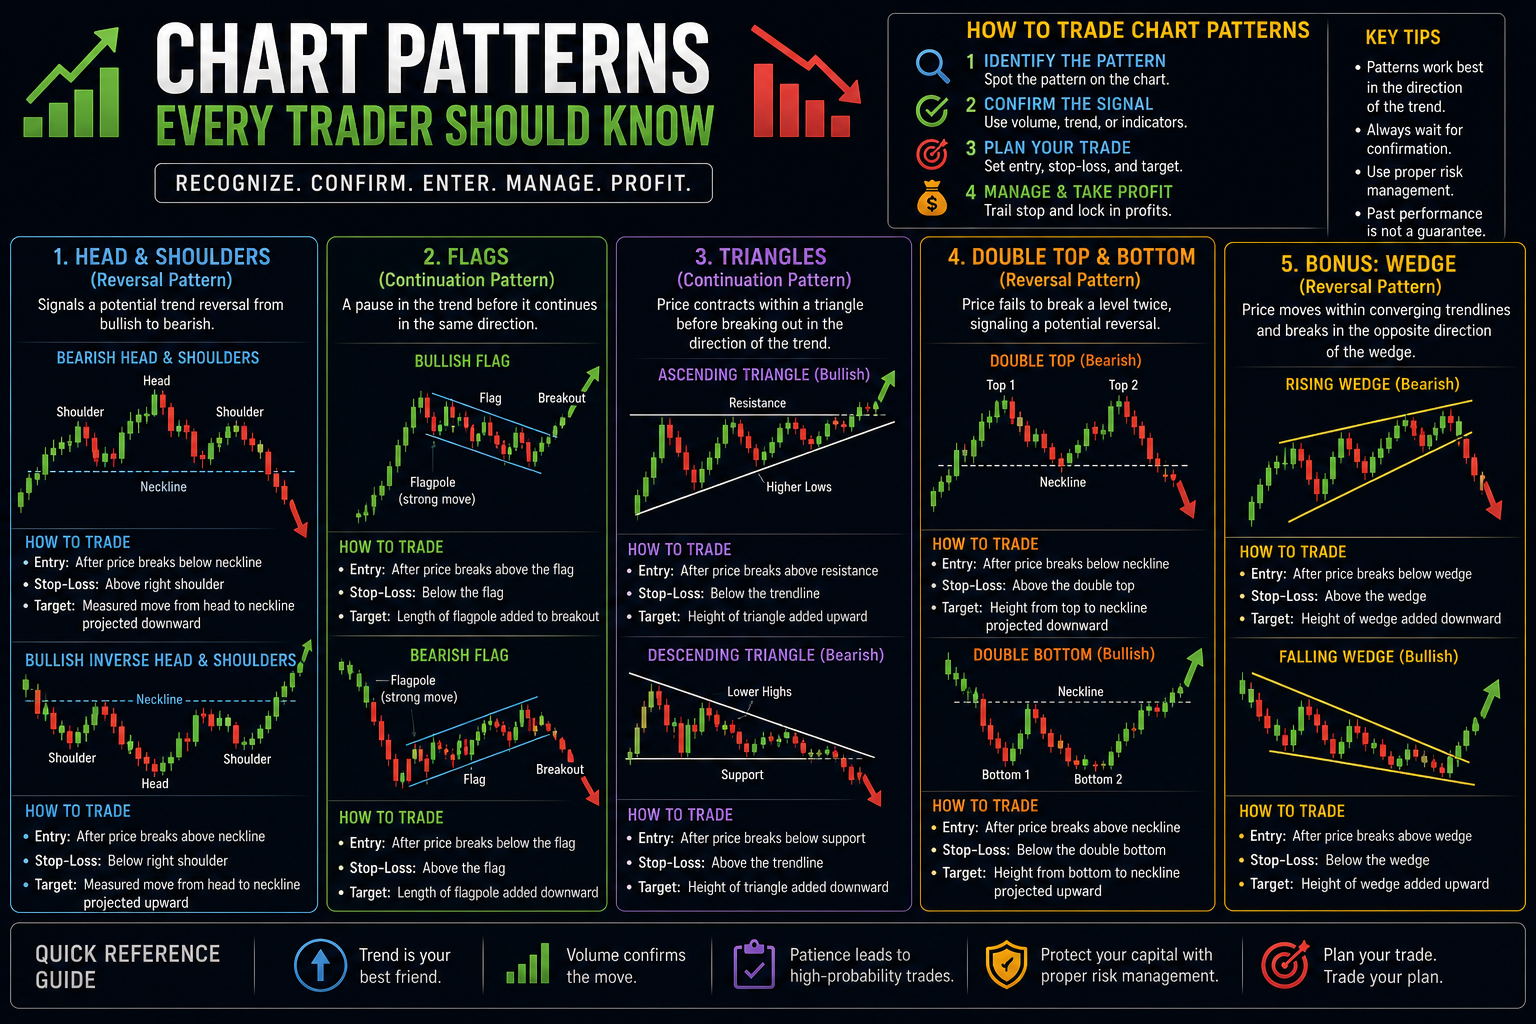
Chart patterns are the foundation of price action trading. They form when price movements create recognizable shapes that often signal future direction with high probability. Learning to spot these patterns gives traders a significant edge in predicting reversals and continuations. In this comprehensive guide, we’ll cover the most important chart patterns every trader should know: … Read more
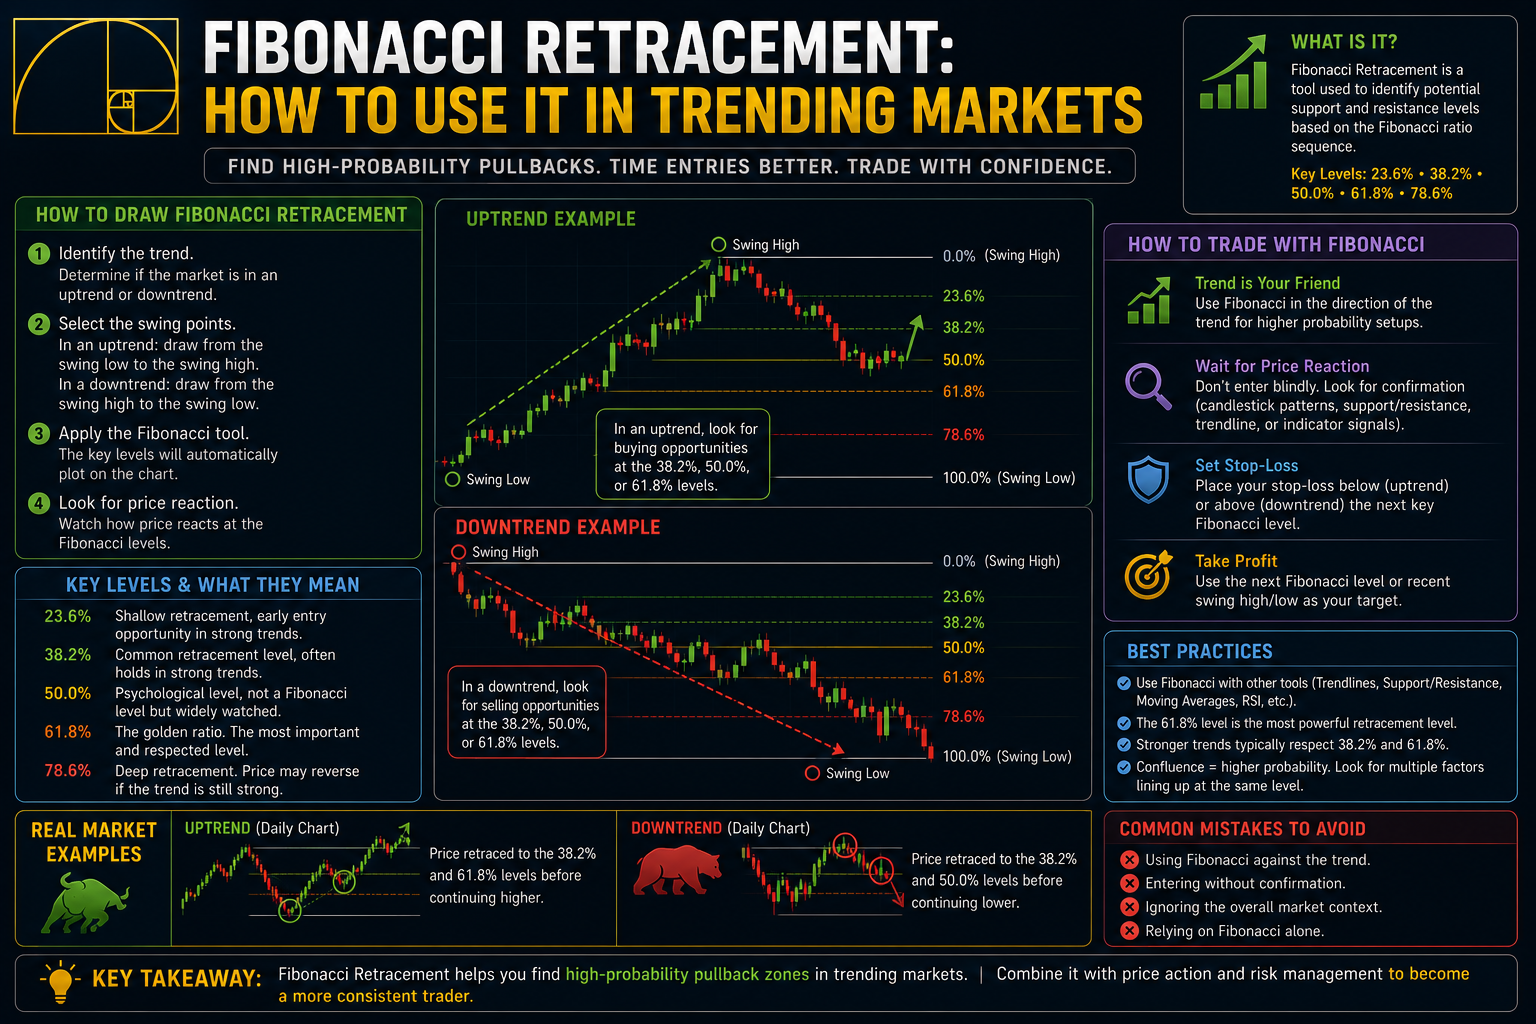
Fibonacci Retracement is one of the most powerful and widely respected tools in technical analysis. Based on the mathematical Fibonacci sequence, these levels often act as precise support and resistance zones where price tends to retrace before continuing in the direction of the main trend. In this complete guide, you’ll learn what Fibonacci retracements are, … Read more
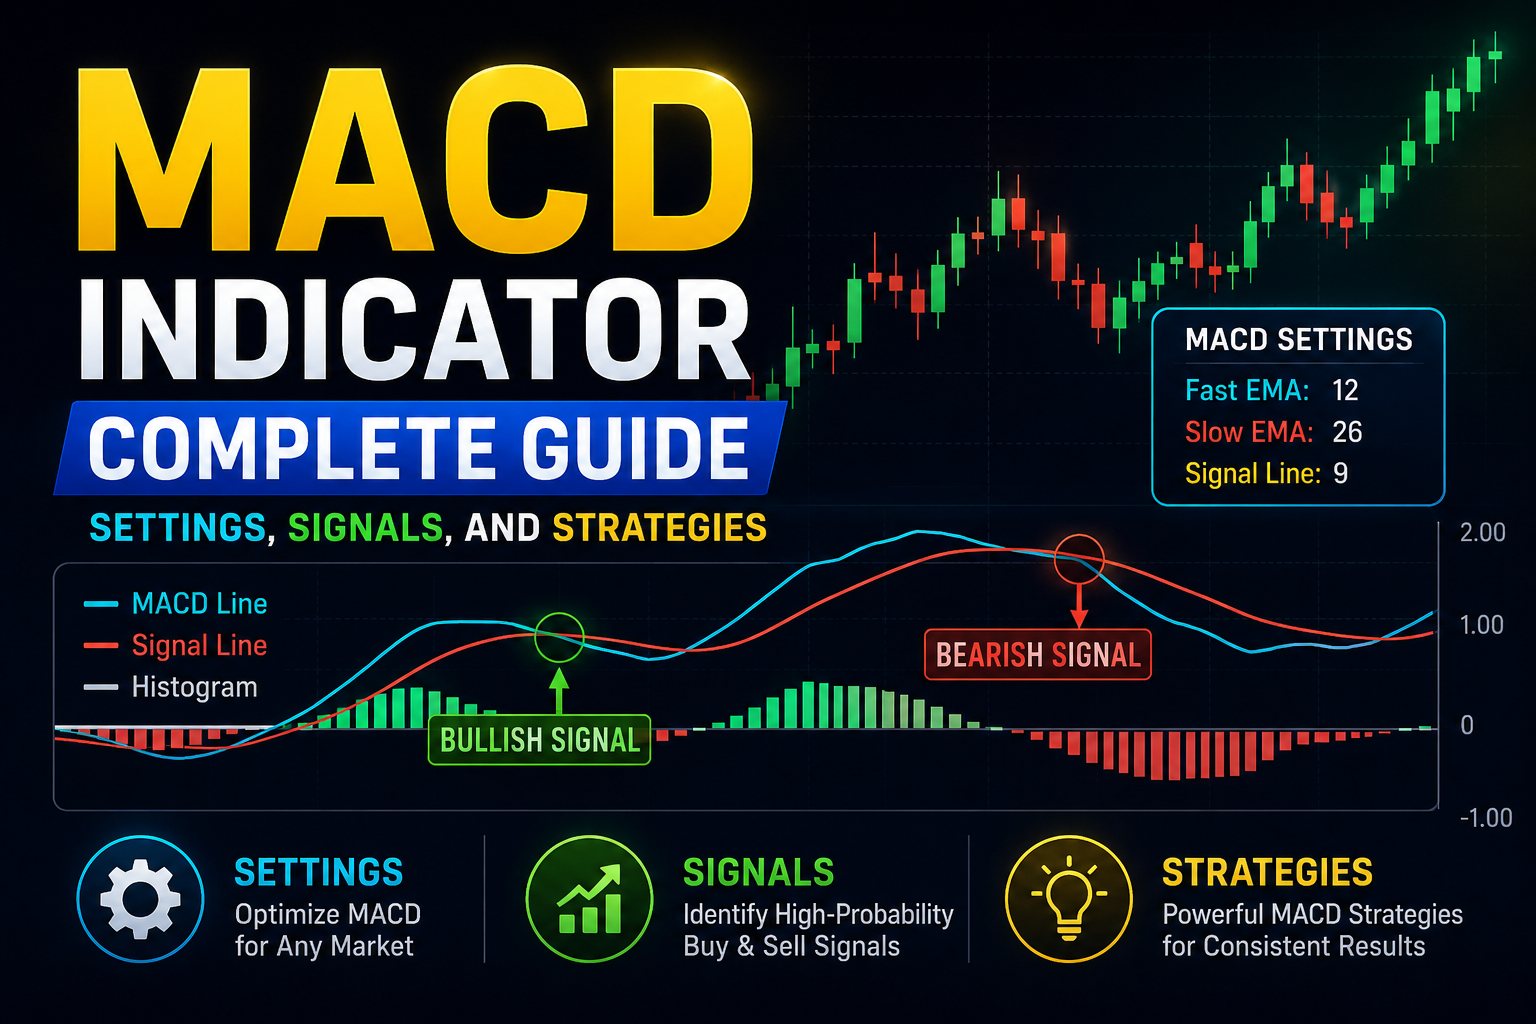
The Moving Average Convergence Divergence (MACD) is one of the most popular and versatile technical indicators in trading. Created by Gerald Appel in the late 1970s, the MACD helps traders identify changes in momentum, trend direction, and potential reversals. In this complete guide, you’ll learn exactly how the MACD works, the best settings, key trading … Read more
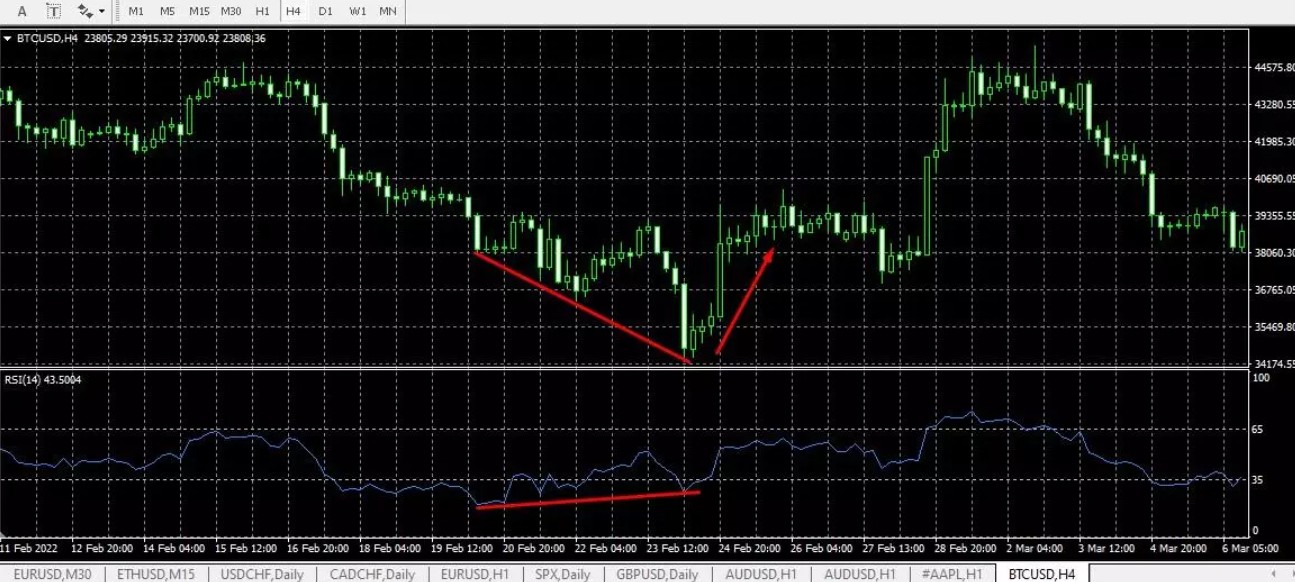
The Relative Strength Index (RSI) is one of the most popular and powerful momentum oscillators used by traders worldwide. Developed by J. Welles Wilder in 1978, the RSI helps traders identify potential trend reversals by measuring the speed and magnitude of recent price movements. In this comprehensive beginner’s guide, you’ll learn exactly what the RSI … Read more
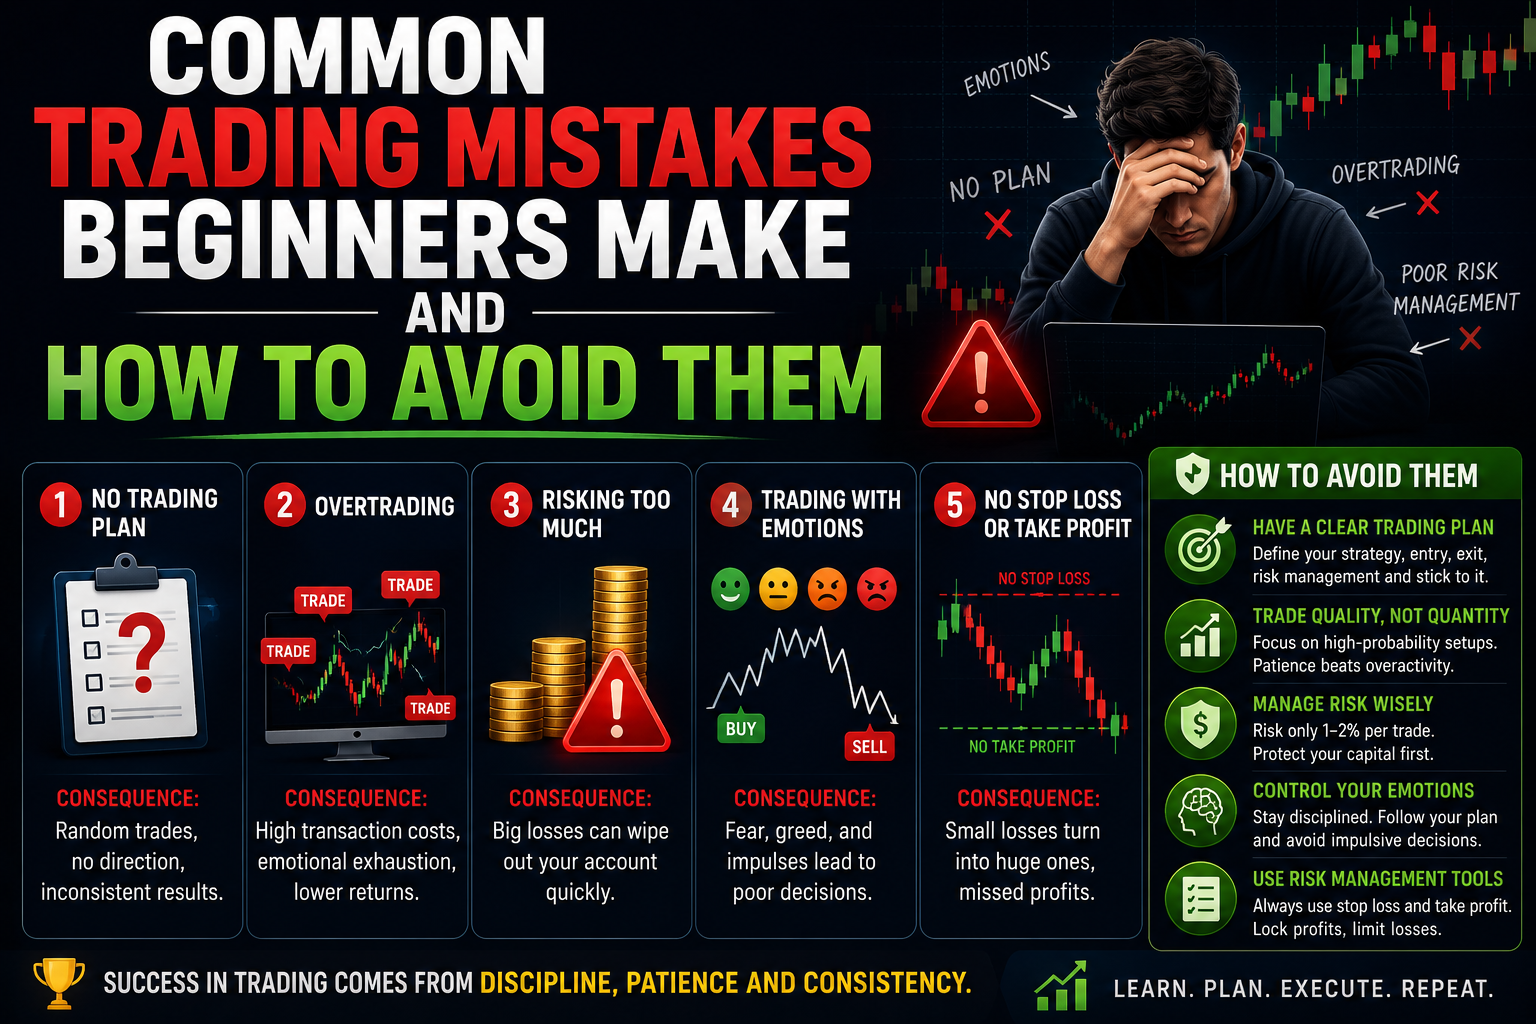
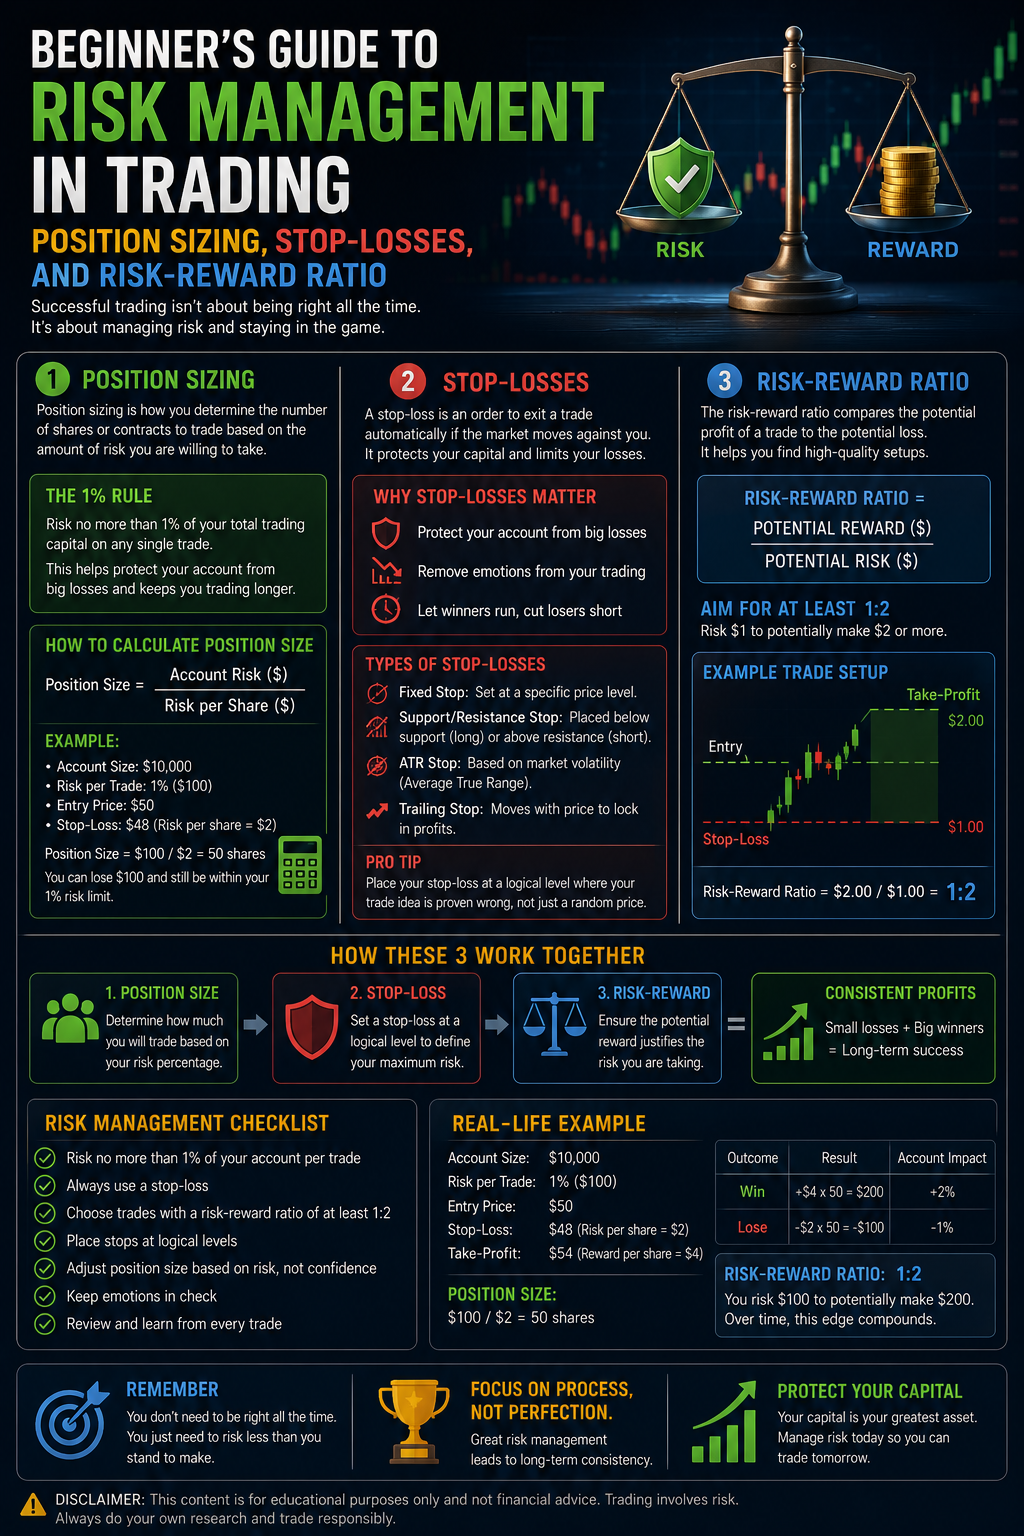
The mistakes that hurt are not exotic. They repeat because they feel reasonable in the minute you make them. These are the ones I still audit. Each has a counter-rule I can check yes/no. 1. Risk that grows with conviction “This one is obvious” becomes 3%. Conviction is not a sizing input. Size comes from … Read more
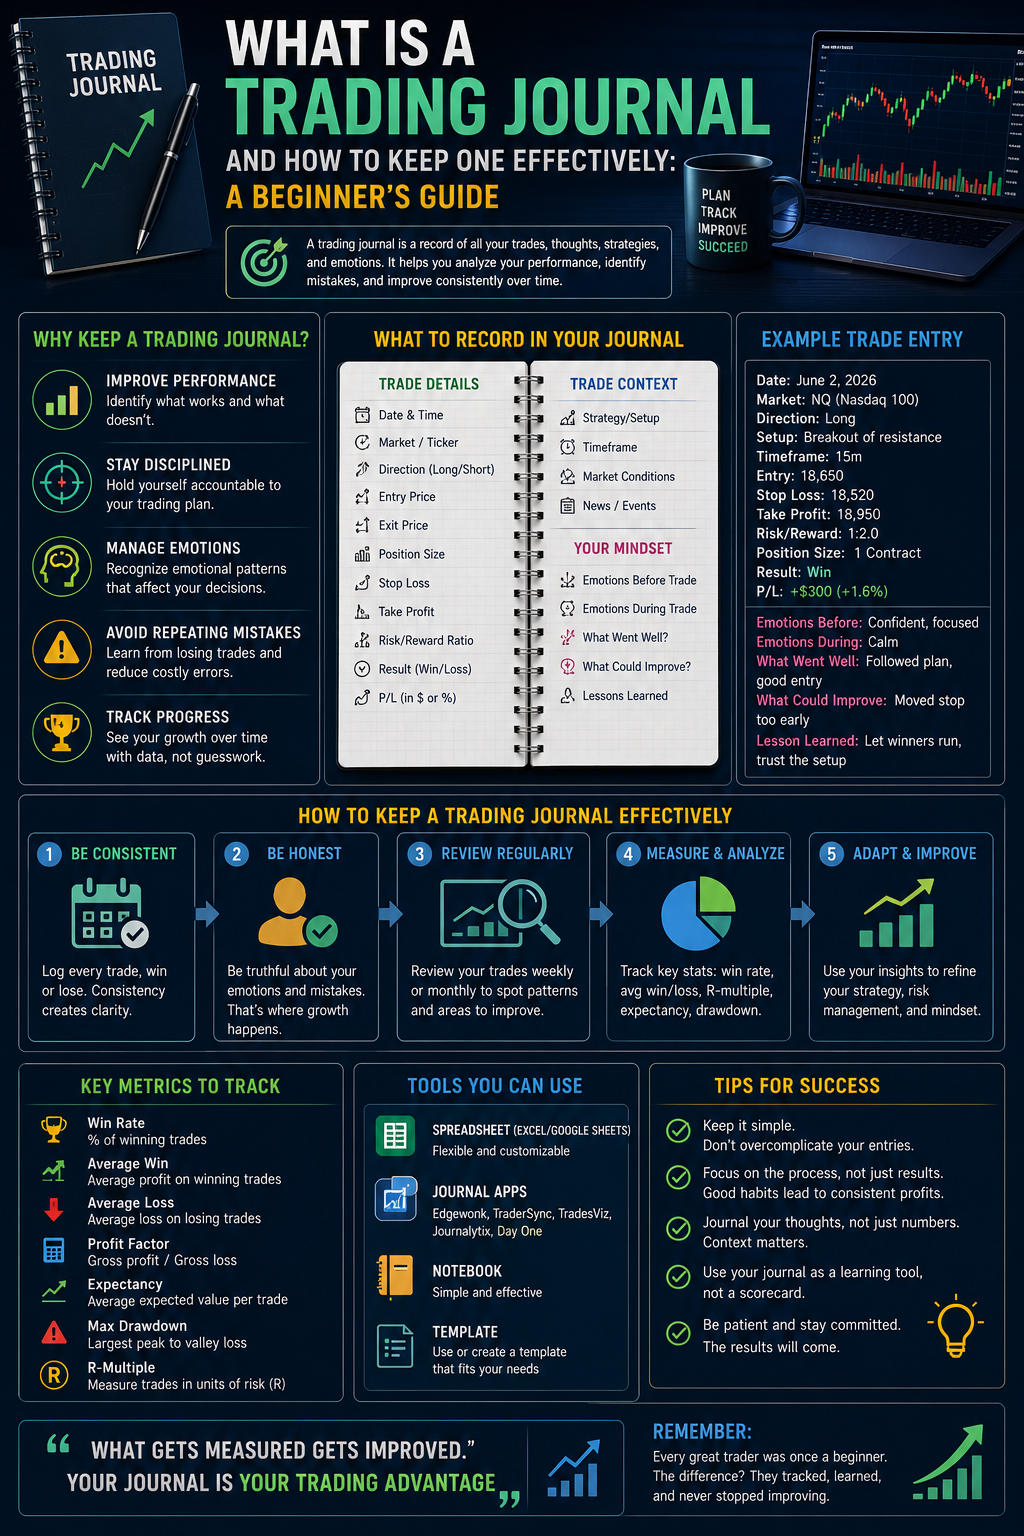
A journal is not a diary of how you feel about the market. It is a log of decisions, so next month you are not arguing from memory. I keep two layers because they do different jobs: – A fast note at the desk (paper or a simple app) for the sentence I will lie … Read more
Most beginners hunt for a better setup. The account usually dies from size. I learned that the slow way: a “small” extra lot during a losing streak, then another, then a day that wiped more than a week of careful work. The strategy was not the main problem. The unit of risk was. This page … Read more
Moving Averages are one of the most widely used technical indicators in trading. They help smooth out price data to identify trends, reduce market noise, and generate clear trading signals. Whether you trade stocks, forex, crypto, or futures, understanding Simple Moving Averages (SMA) and Exponential Moving Averages (EMA) is essential for both beginners and experienced … Read more
Content on traderslook.com is for educational and informational purposes only and should not be construed as professional financial advice
"As an Amazon Associate I earn from qualifying purchases"