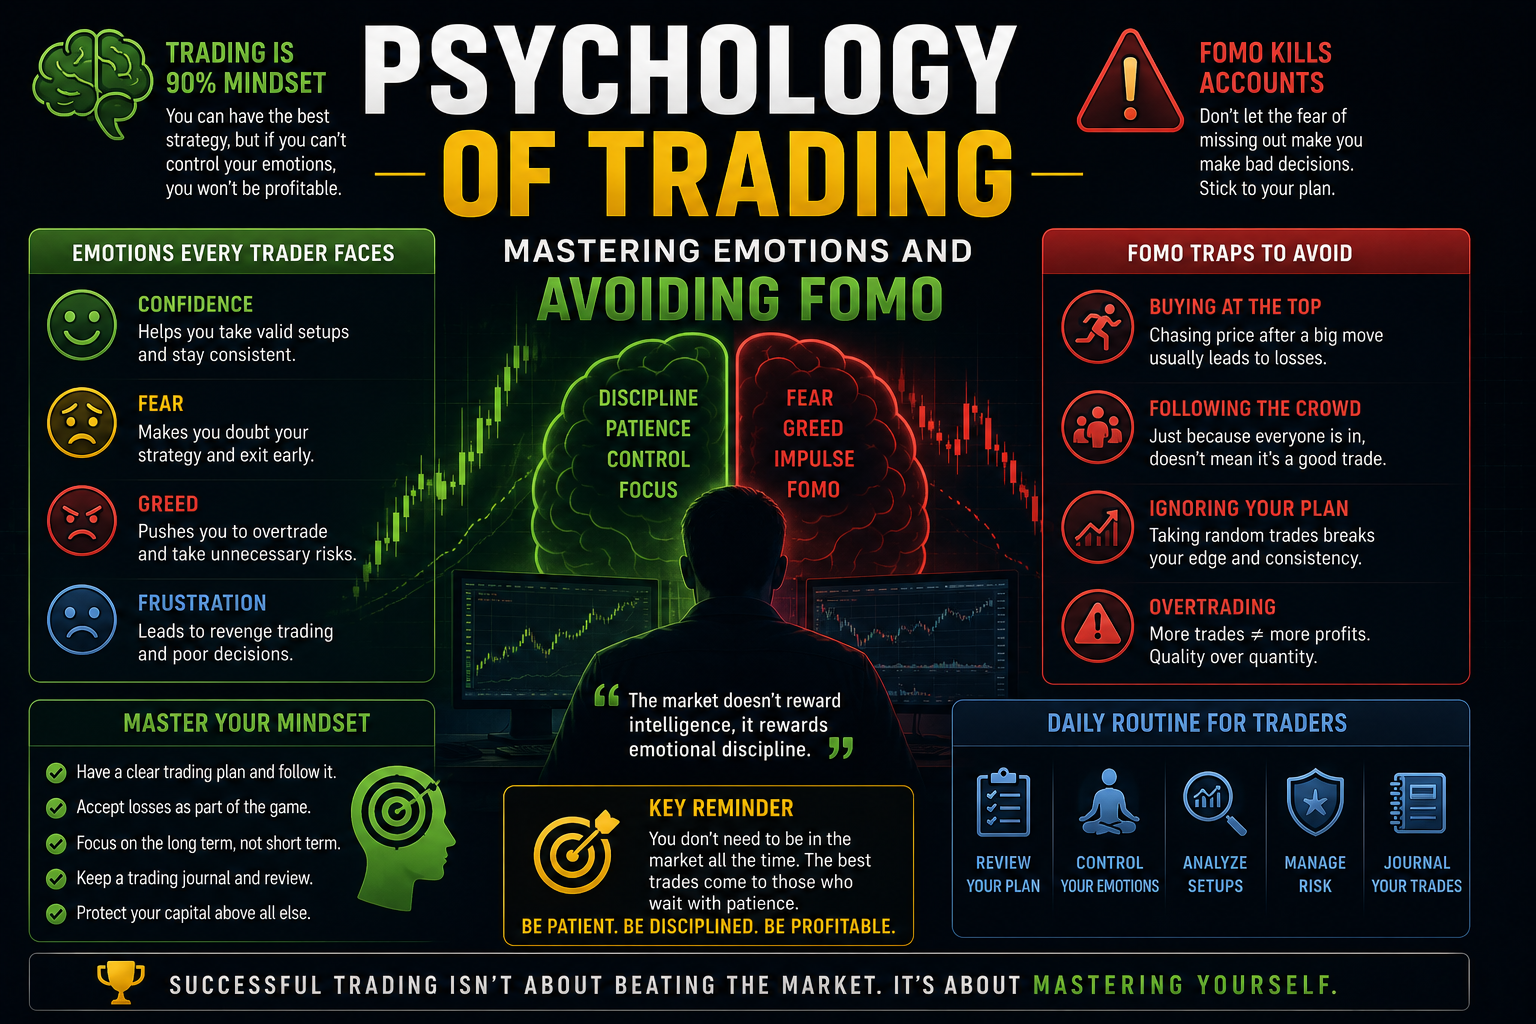
FOMO is not a personality flaw. It is what happens when a moving candle is allowed to vote. I still feel it. The difference is whether that feeling can send an order. The plan and the checklist exist so the feeling has nowhere to click. What FOMO looks like on a desk – Entering after … Read more
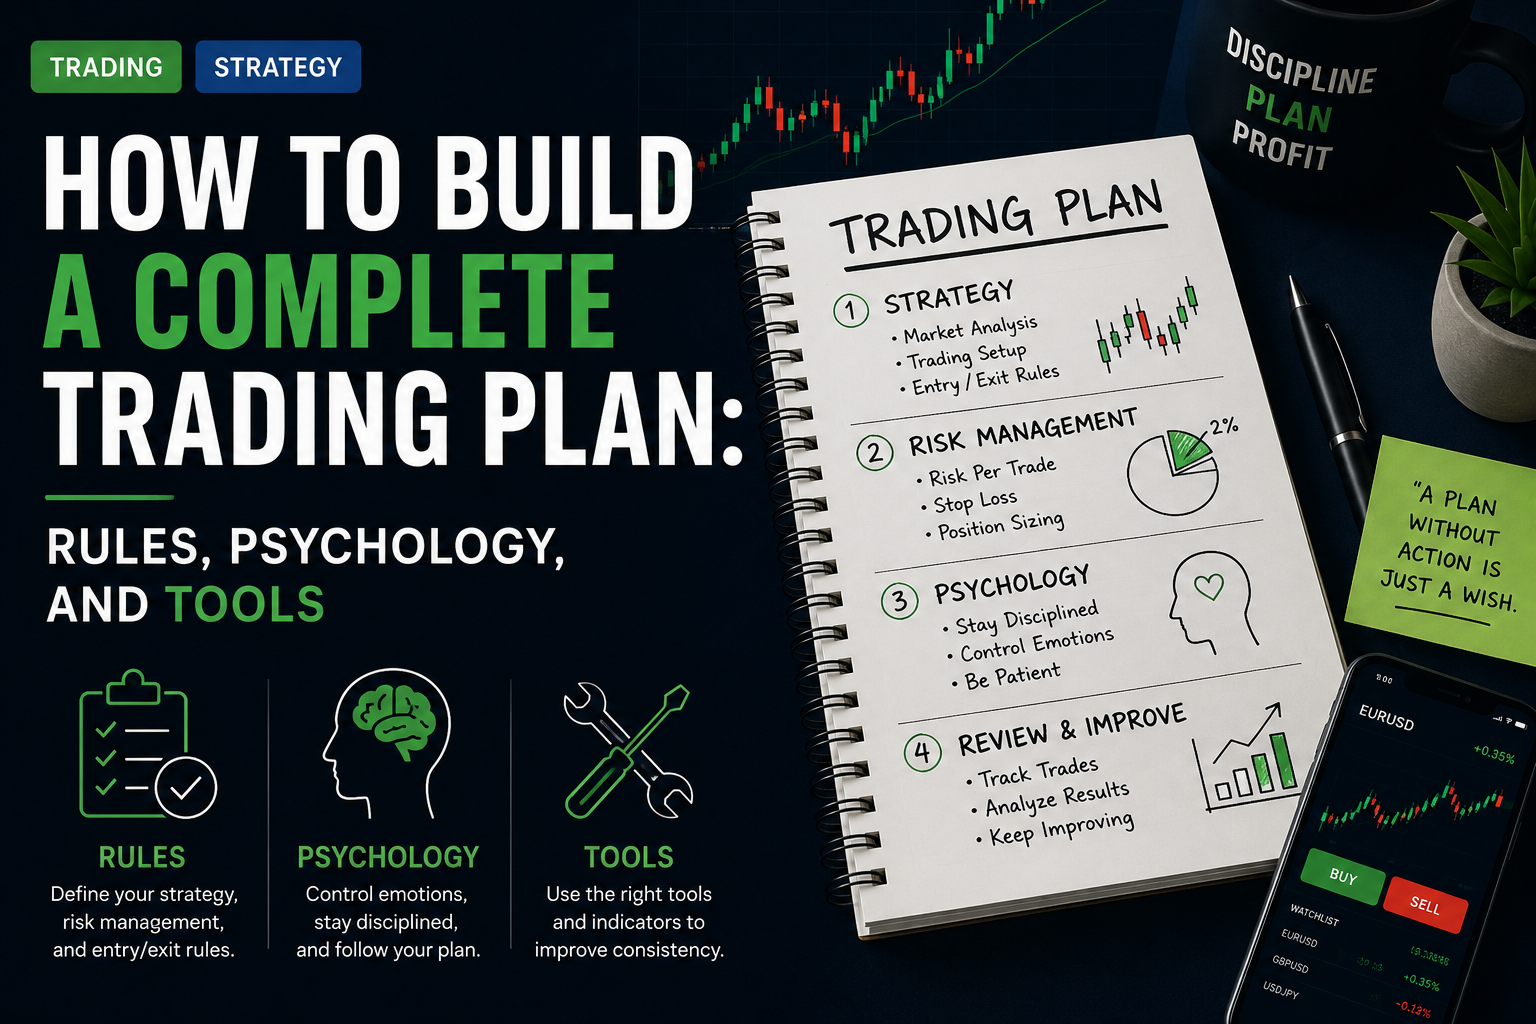
A trading plan is the document you obey when the chart is exciting. If it only exists in your head, it will change every session. Mine is one page plus the checklist. If it needs a binder, I will not read it at the open. What the page must contain 1. Style and hours Swing or … Read more
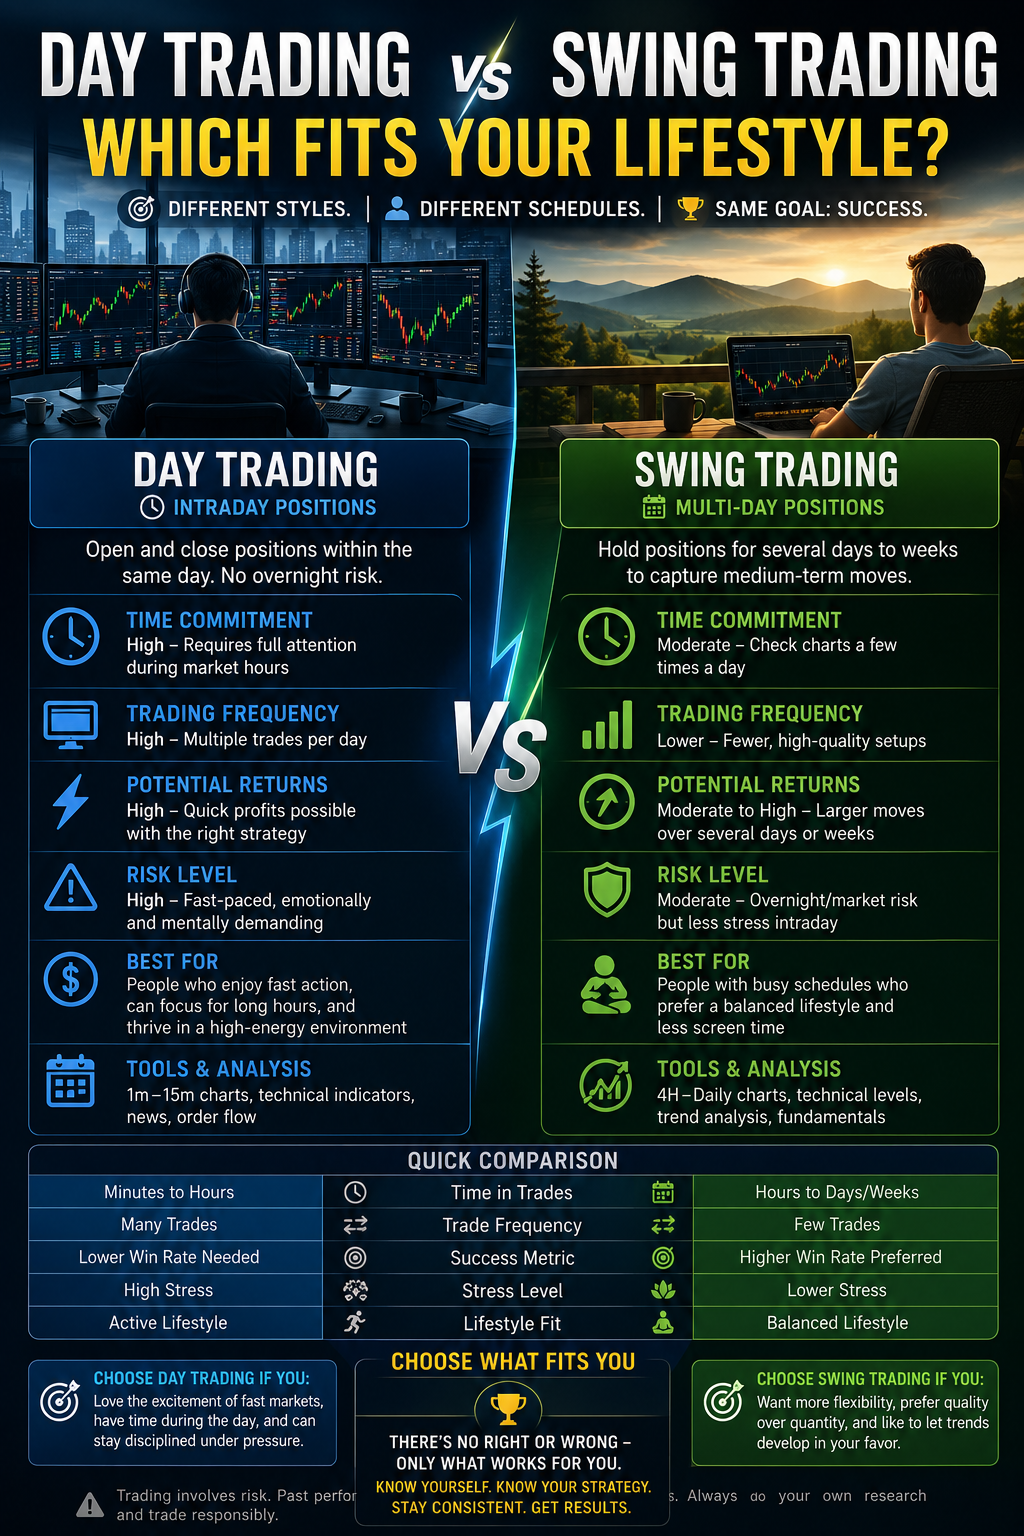
Style is a calendar problem before it is a strategy problem. If you have 40 minutes after work, you do not have a day-trading job. You have a window. Forcing 5-minute charts into that window is how swing rules die and FOMO gets a time stamp. Two jobs Day / session You are in front … Read more
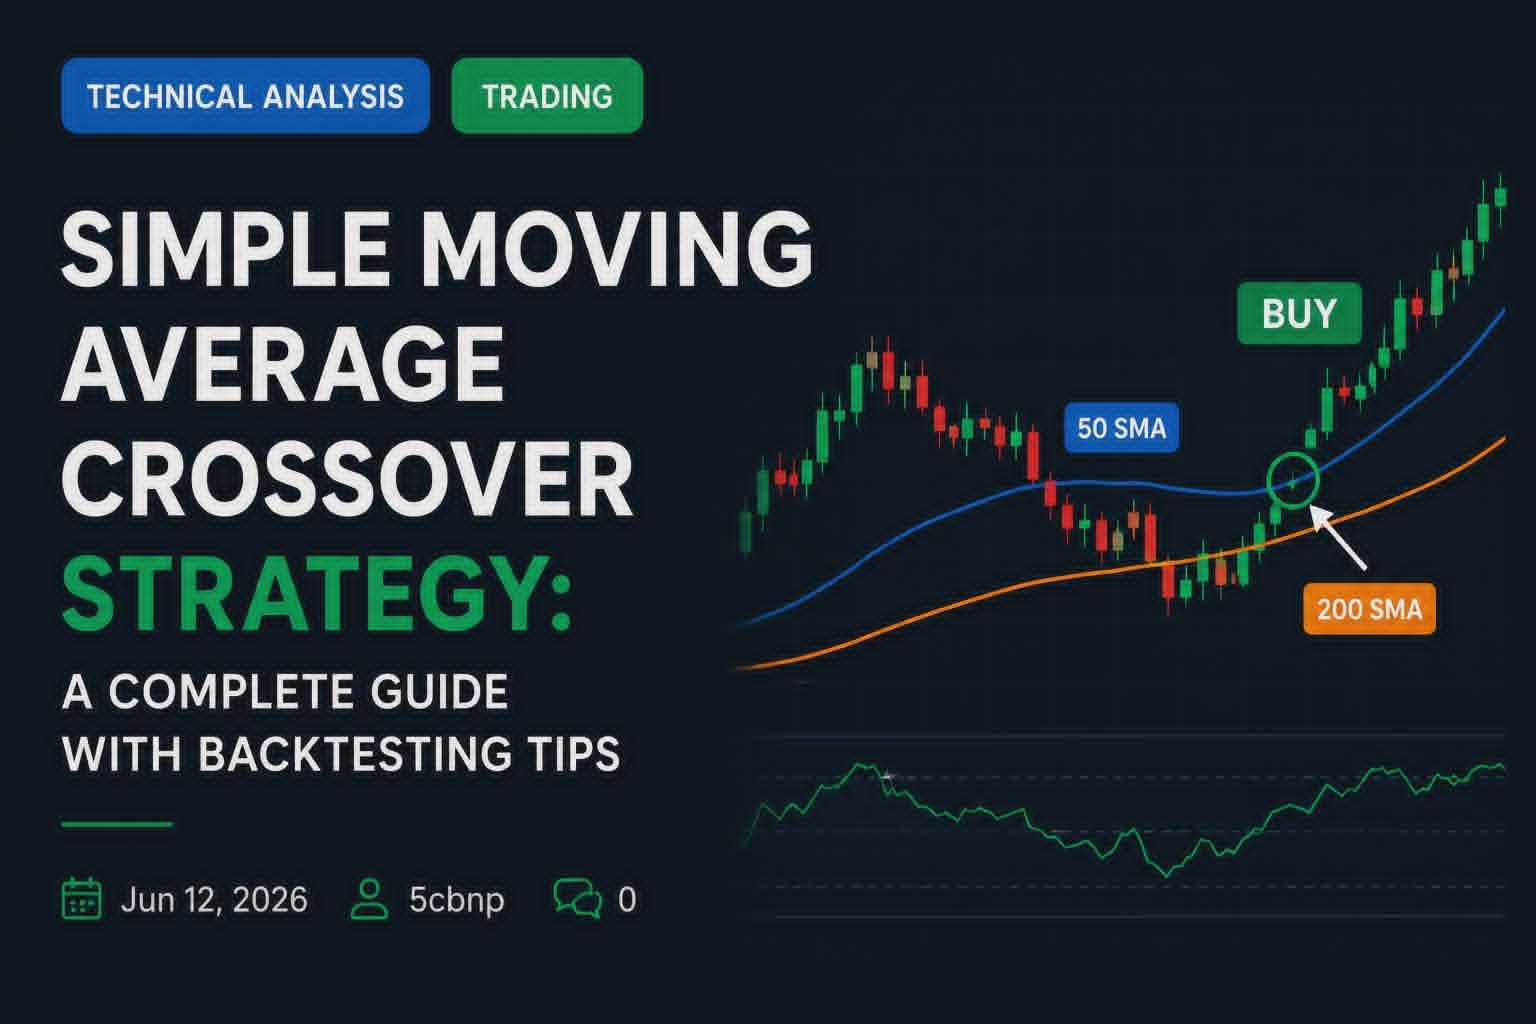
The Simple Moving Average (SMA) Crossover Strategy is one of the most popular and beginner-friendly trading strategies in technical analysis. It is easy to understand, rule-based, and works across stocks, forex, crypto, and futures. This strategy uses two moving averages of different lengths to generate clear buy and sell signals. In this comprehensive guide, you’ll … Read more
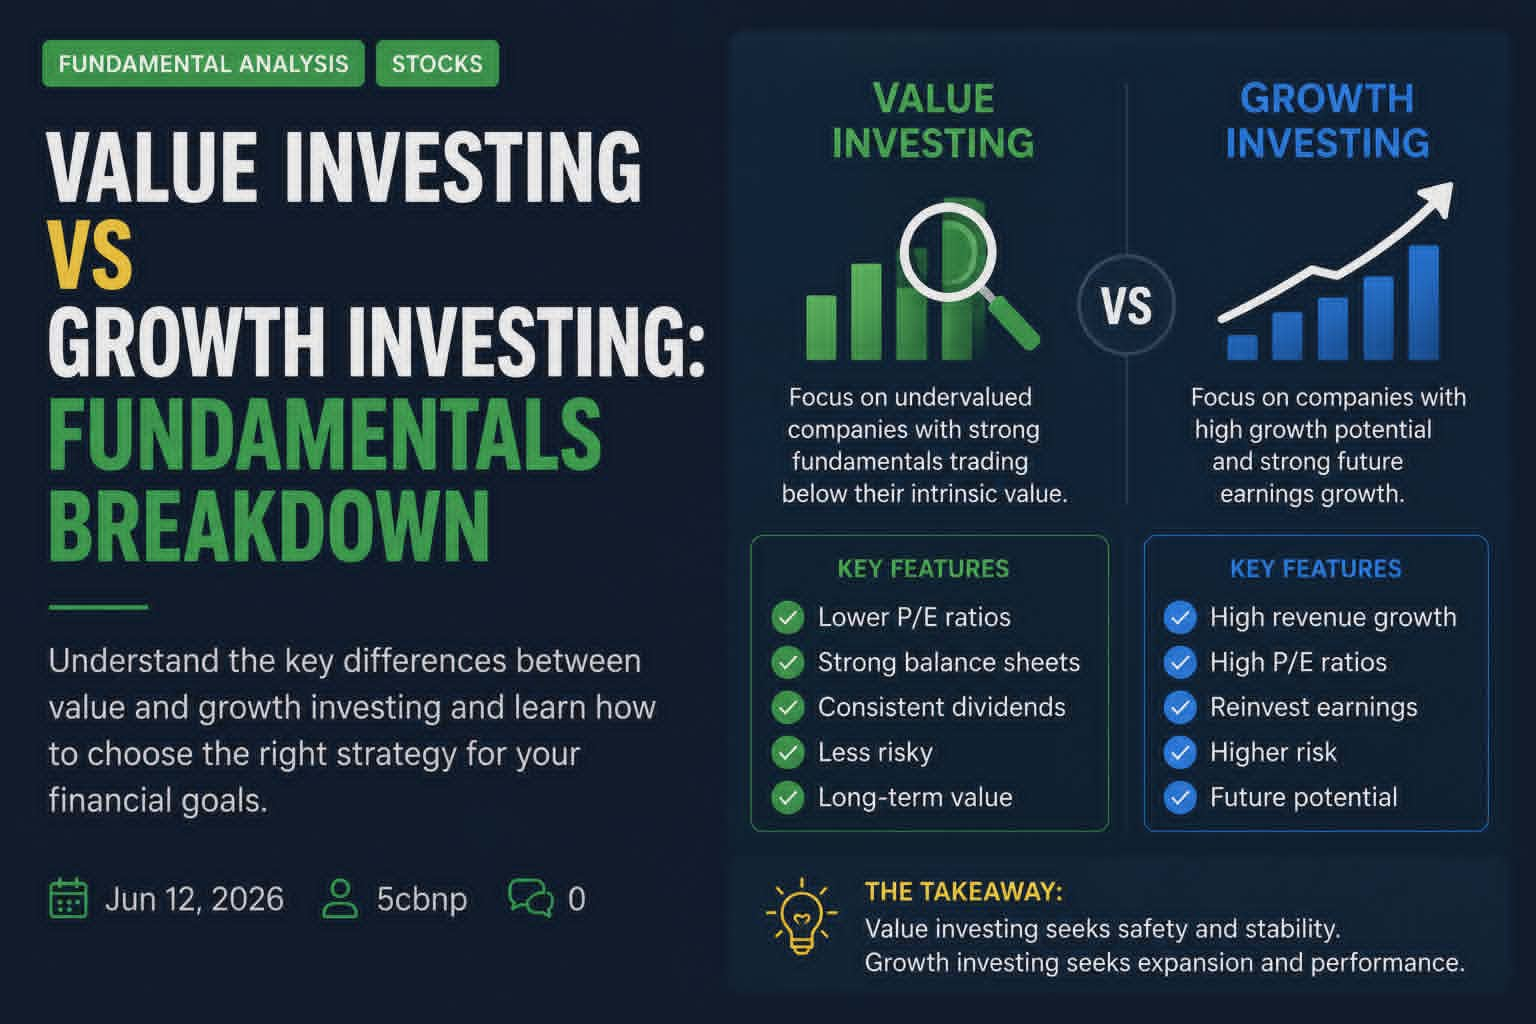
Introduction When it comes to fundamental analysis and long-term investing, two of the most popular approaches are Value Investing and Growth Investing. Understanding the differences between them will help you choose a style that fits your personality, risk tolerance, and goals. In this guide,’ll break down what each strategy is, the key metrics investors look … Read more
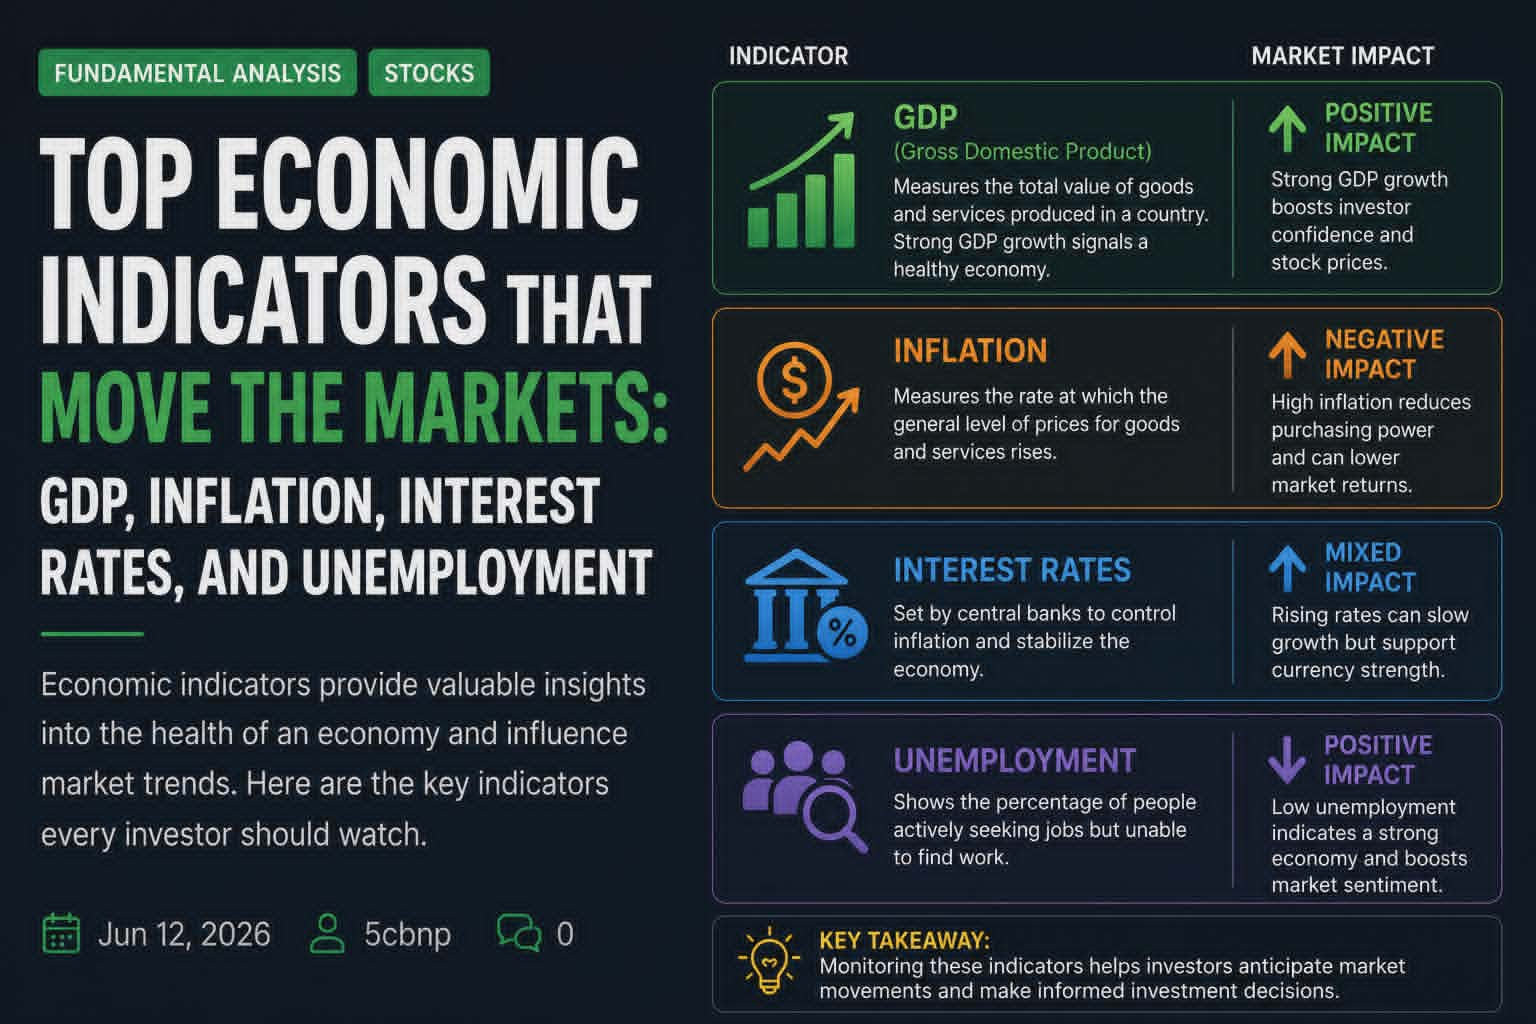
Economic indicators are the heartbeat of the financial markets. They reveal the health of the economy and heavily influence central bank decisions, investor sentiment, and price movements across stocks, forex, bonds, and commodities. Understanding the top economic indicators is essential for both fundamental traders and technical traders who want to avoid trading against major macro … Read more
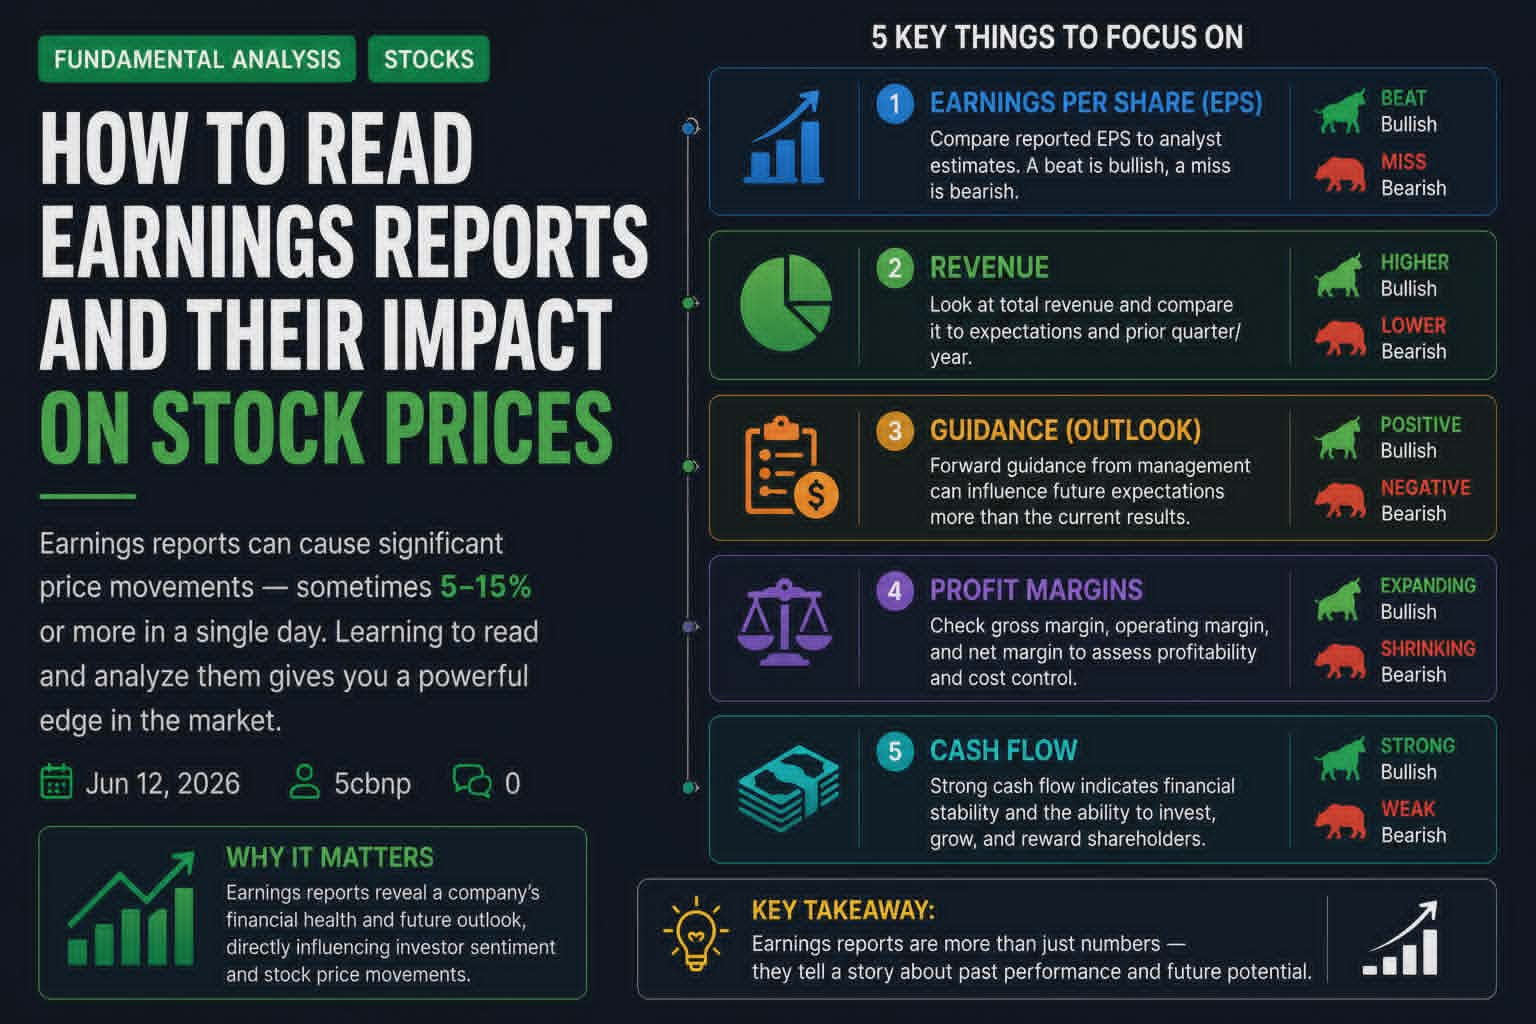
significant price movements — sometimes 5–15% or more in a single day. Learning to read earnings reports effectively can give you a major edge in both fundamental and technical trading. In this guide, you’ll learn what to look for in an earnings report, how to interpret the key sections, and why the market reacts the … Read more
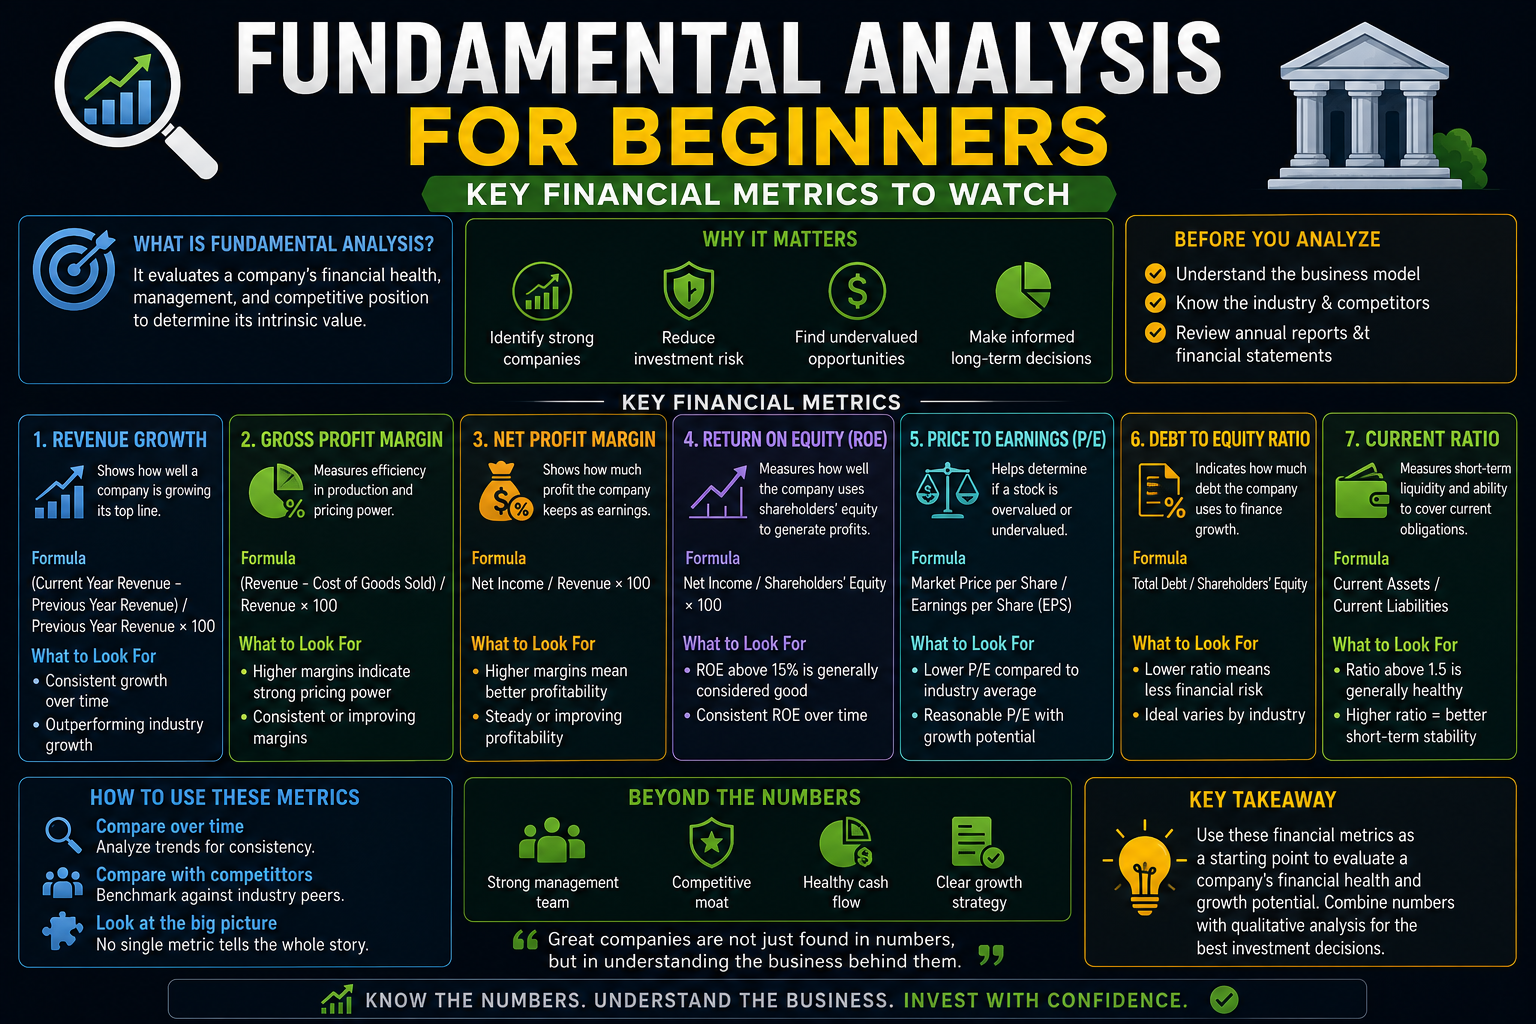
While technical analysis focuses on price charts and patterns, fundamental analysis looks at the actual health and value of a company. It answers the question: “Is this business worth investing in?” Fundamental analysis is especially valuable for long-term investors and swing traders. In this beginner-friendly guide, you’ll learn the most important financial metrics to watch, … Read more
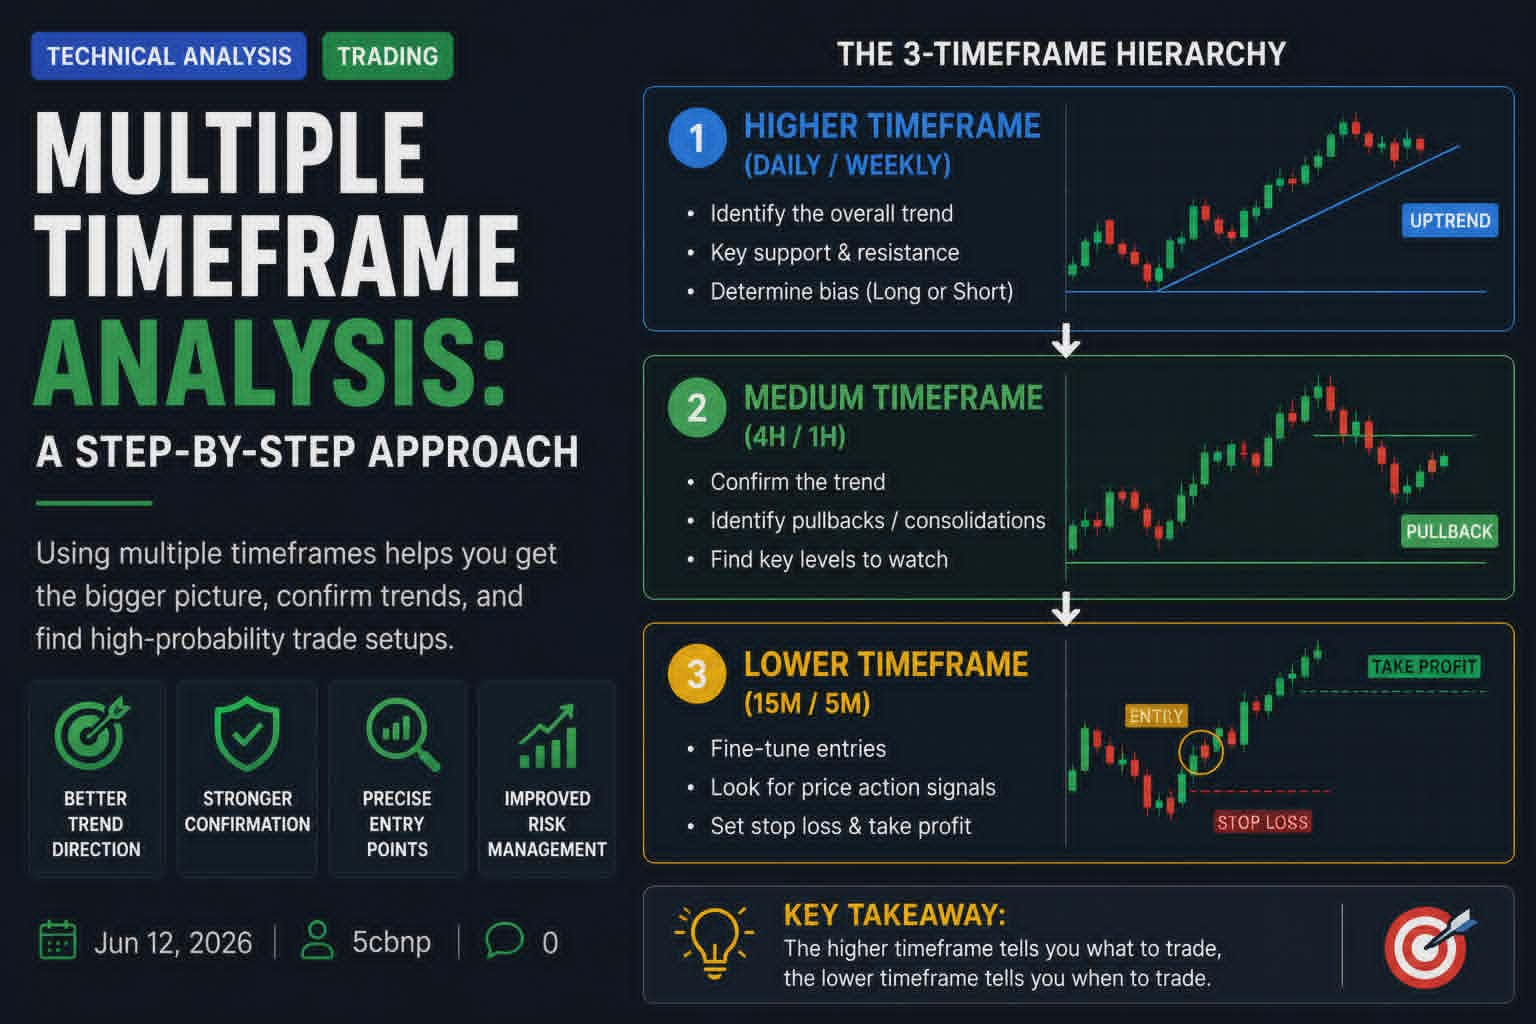
Multiple timeframes are useful until they become a way to find a chart that agrees with you. I use three clocks of one market. I wrote the short version as one market, three timeframes. This page is the fuller walkthrough. The stack Weekly Story of last week’s auction: high, low, close. I do not place … Read more
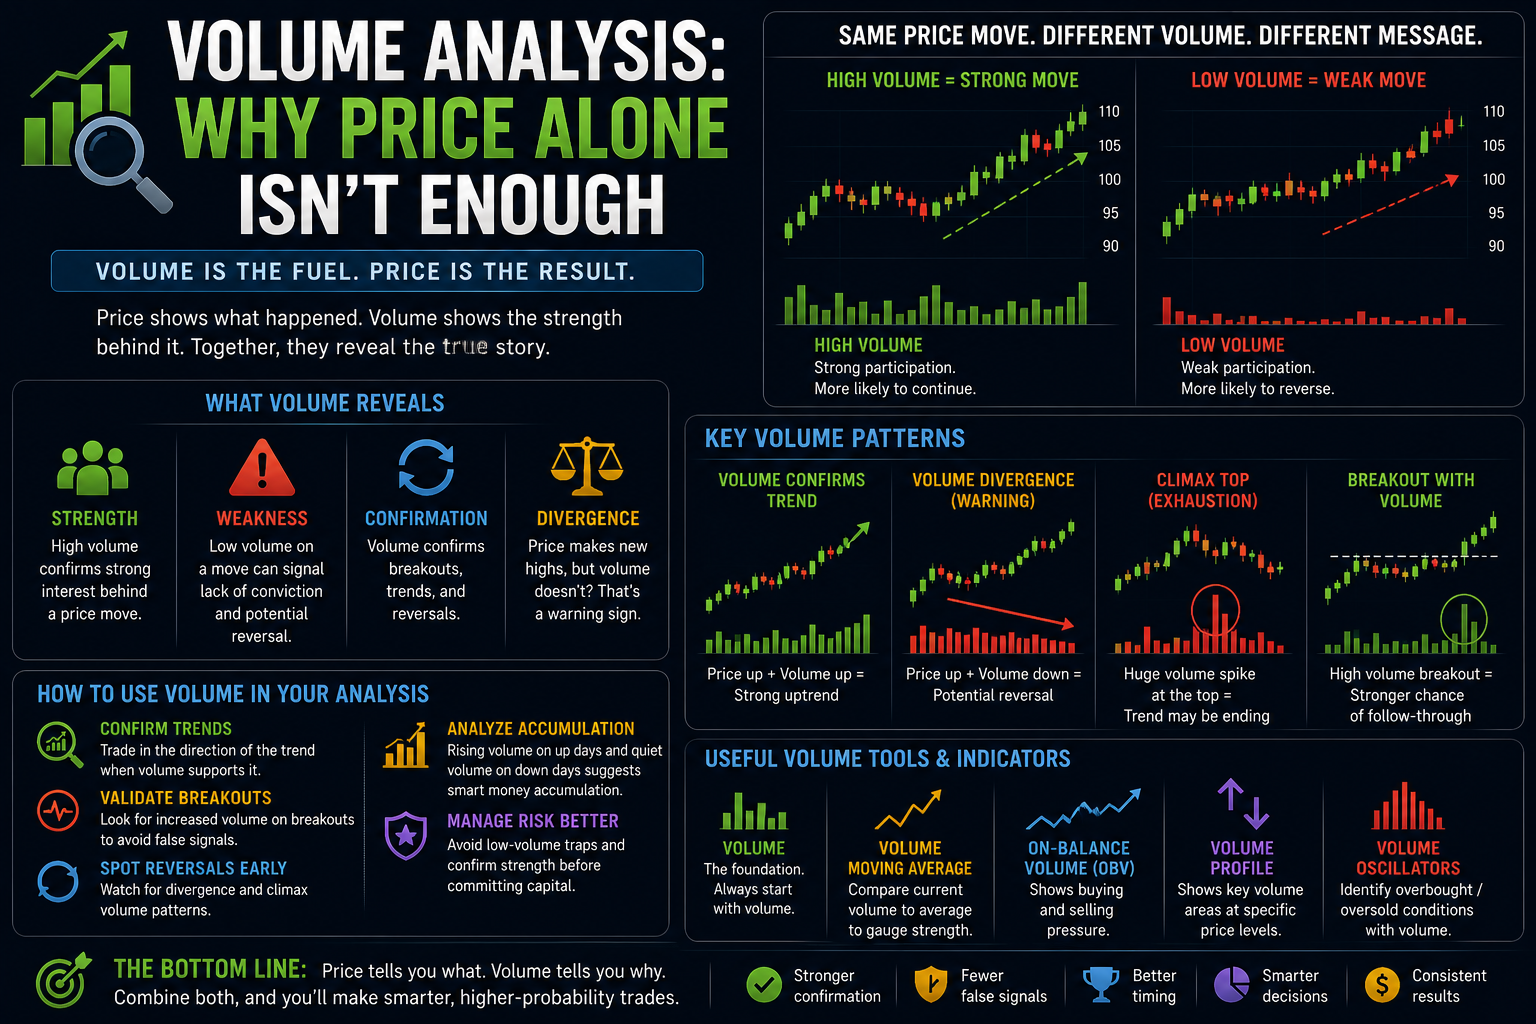
Price is what most beginners focus on when analyzing charts. However, professional traders know that volume is the fuel that drives price movements. Understanding volume analysis can dramatically improve your ability to confirm trends, spot reversals, and avoid false breakouts. In this comprehensive guide, you’ll learn what volume really means, how to interpret it alongside … Read more
Content on traderslook.com is for educational and informational purposes only and should not be construed as professional financial advice
"As an Amazon Associate I earn from qualifying purchases"